Download

Download Manuals, Datasheets, Software and more:

DOWNLOAD TYPE
MODEL or KEYWORD

Feedback

2 Series MSO Help

MSO22 and MSO24 Instrument Help

The 2 Series MSO help provides operation, features, and function information. The help is also available on your instrument.


This manual applies to:

2 Series MSO Portable Mixed Signal Oscilloscope

  • Manual Type: Primary User
  • Part Number: 077171604
  • Release Date:
  • Revision: Rev A

By downloading, you agree to the terms and conditions of the Manuals Download Agreement.

Manuals Download Agreement

ATTENTION: please read the following terms and conditions carefully before downloading any documents from this website. By downloading manuals from Tektronix' website, you agree to the following terms and conditions:

Manuals for Products That Are Currently Supported:

Tektronix hereby grants permission and license to owners of Tektronix instruments to download and reproduce the manuals on this website for their own internal or personal use. Manuals for currently supported products may not be reproduced for distribution to others unless specifically authorized in writing by Tektronix, Inc.

A Tektronix manual may have been revised to reflect changes made to the product during its manufacturing life. Thus, different versions of a manual may exist for any given product. Care should be taken to ensure that one obtains the proper manual version for a specific product serial number.

Manuals for Products That Are No Longer Supported:

Tektronix cannot provide manuals for measurement products that are no longer eligible for long term support. Tektronix hereby grants permission and license for others to reproduce and distribute copies of any Tektronix measurement product manual, including user manuals, operator's manuals, service manuals, and the like, that (a) have a Tektronix Part Number and (b) are for a measurement product that is no longer supported by Tektronix.

A Tektronix manual may be revised to reflect changes made to the product during its manufacturing life. Thus, different versions of a manual may exist for any given product. Care should be taken to ensure that one obtains the proper manual version for a specific product serial number.

This permission and license does not apply to any manual or other publication that is still available from Tektronix, or to any manual or other publication for a video production product or a color printer product.

Disclaimer:

Tektronix does not warrant the accuracy or completeness of the information, text, graphics, schematics, parts lists, or other material contained within any measurement product manual or other publication that is not supplied by Tektronix or that is produced or distributed in accordance with the permission and license set forth above.

Tektronix may make changes to the content of this website or to its products at any time without notice.

Limitation of Liability:

TEKTRONIX SHALL NOT BE LIABLE FOR ANY DAMAGES WHATSOEVER (INCLUDING, WITHOUT LIMITATION, ANY CONSEQUENTIAL OR INCIDENTAL DAMAGES, DAMAGES FOR LOSS OF PROFITS, BUSINESS INTERRUPTION, OR FOR INFRINGEMENT OF INTELLECTUAL PROPERTY) ARISING OUT OF THE USE OF ANY MEASUREMENT PRODUCT MANUAL OR OTHER PUBLICATION PRODUCED OR DISTRIBUTED IN ACCORDANCE WITH THE PERMISSION AND LICENSE SET FORTH ABOVE.


Read Online

2 Series MSO Help
MENUS AND DIALOG BOXES

TEKTRONIX END USER LICENSE AGREEMENT

Go to www.tek.com/terms_and_conditions to read the Tektronix End User License Agreement.


Open Source GPL License Notice

For programs licensed under the "GNU General Public License (GPL) or Lesser GNU General Public License (LGPL)" the complete corresponding sources are available. You can order a CD containing the sources from us for a period of three years after download of the software, by sending a written request to:

Chief Intellectual Property Counsel, Tektronix, Inc.

MS 50/LAW

14150 SW Karl Braun Dr.

Beaverton OR, 97077

This offer is valid to anyone in receipt of this information.

Your request should include: (i) the name of the product, (ii) your (company) name, and (iii) your return mailing and email address (if available).

Please note that we may charge you a fee to cover the cost of performing this distribution.

All the copyright and license information of open source packages used in the product software are available in attribution.zip present in C drive of instrument.

Instrument compliance markings

The following table list the compliance markings that apply to the 2 Series MSO instrument.

Compliance labelsDescription
CE MARK CE marking is a certification mark that indicates conformity with health, safety, and environmental protection standards for products sold within the European Economic Area.
WEEE MARK WEEE marking indicating separate collection for WEEE- Waste of electrical and electronic equipment. The mark is required per Article 11(2) of the WEEE Directive.
TB RoHS MARKTB RoHS marking indicates that the item is certified by Tektronix to be RoHS Compliant to the 10 restricted substances according to EU Directive 2015/863 and that Tektronix has published a TDoC and/or DoC.
CSA MARK CSA marking is a certification mark that indicates that a sample of the product has been independently tested and certified to meet recognized standards for safety or performance.
CHINA RoHS 40 MARK China RoHS 40 marking is a certification mark that indicates conformity with the Chinese government regulation to control the restriction of hazardous substances for products shipped to China.
RCM MARK RCM (Regulatory Compliance Mark) marking is a certification mark that signifies product compliance with electrical safety, EMC, EME & telecommunications for Australia and New Zealand.
BC MARK BC marking is a certification mark for Battery Chargers that indicates compliance with California’s Title 20 Appliance Efficiency Regulations.
UKCA MARKUKCA (UK Conformity Assessed) marking is a new UK certification mark that indicates conformity with health, safety, and environmental protection standards for products sold within Great Britain (England, Wales and Scotland). It covers most goods which previously required the CE marking.
UKRAINE MARKUkraine marking is the certification mark that indicates conformity to applicable technical regulations for products sold within the Ukraine.
COMPLIANCE CONTACT ADDRESS MARK - TEK Compliance Contact Address marking is the point of contact address for Tektronix Compliance department.
KCC-REM-tek-OSC MARK KC (Korea Certification) mark signifies compliance with Korea’s product safety requirements for electrical and electronic equipment / Tektronix Major Product Type: Oscilloscopes / Tektronix Product ID Code: KCC-REM-tek-OSC

Welcome to the 2 Series MSO Help

This Help supports the 2 Series MSO (MSO22, MSO24). See the following information on the key features of the instrument.

MSO22 and MSO24 key features and benefits

  • Bandwidths from 70 MHz to 500 MHz
  • 2- and 4- analog channel inputs
  • 10.1" TFT color (1280 x 800 pixels) Capacitive multi-touch display
  • User interface optimized for touch screen use
  • 2.5 GS/s sample rate for half channels and 1.25 GS/s sample rate for all channels
  • 10 M points record length on all channels
  • Battery pack option includes 2 battery slots and hot-swap capability of the batteries within the battery pack module
  • No set limit on the number of math, reference, and bus waveforms you can display (the number of waveforms depends on available system memory)
  • Integrated options include 16 Channel MSO, 50 MHz Arbitrary Function Generator (AFG), 4 Bit Digital Pattern Generator, and trigger frequency counter
  • Advanced serial bus triggering and analysis option lets you decode and trigger on industry standard buses
  • Industry standard VESA interface can be used with several accessories offered by Tektronix and it is also compatible with off the shelf VESA mounts

Product documents and support

Finding documentation for your product and contacting Tektronix for support and feedback.

Product support and feedback

Tektronix values your feedback on our products. To help us serve you better, please send us your suggestions, ideas, or comments on your instrument, application, or product documentation.

Contact through mail, telephone, or tek.com.

When you contact Tektronix Technical Support, please include the following information (be as specific as possible):

General information

  • All instrument model numbers
  • Hardware options, if any
  • Probes used
  • Your name, company, mailing address, phone number, and FAX number
  • Please indicate if you would like to be contacted by Tektronix about your suggestion or comments.

Application specific information

  • Software version number
  • Description of the problem such that technical support can duplicate the problem
  • If possible, save and send the setup files for all the instruments used and the application
  • If possible, save and send status messages text files
  • If possible, save and send the waveform on which you are performing the measurement as a .wfm file

Product Documentation

Review the following user documents before installing and using your instrument. These documents provide important operating information.

Product documentation

The following table lists the primary product specific documentation available for your product. These and other user documents are available for download from tek.com. Other information, such as demonstration guides, technical briefs, and application notes, can also be found at tek.com.

DocumentContent
HelpIn-depth operating information for the product. Available from the Help button in the product UI and as a PDF on tek.com.
Quick Start User ManualIntroduction to product hardware and software, installation instructions, turn on, and basic operating information.
Specifications and Performance Verification Technical ReferenceInstrument specifications and performance verification instructions for testing instrument performance.
Programmer ManualCommands for remotely controlling the instrument.
Declassification and Security InstructionsInformation about the location of memory in the instrument. Instructions for declassifying and sanitizing the instrument.

How to find your product documentation

  1. Go to tek.com.
  2. Click Download in the green sidebar on the right side of the screen.
  3. Select Manuals as the Download Type, enter your product model, and click Search.
  4. View and download your product manuals. You can also click the Product Support Center and Learning Center links on the page for more documentation.

Installing your instrument

Operating requirements and setup information to begin using your instrument.

Install option upgrade licenses

Option license upgrades are field-installable licenses that you can purchase after receiving your instrument, to add features to your oscilloscope. You install option upgrades by installing license files on the oscilloscope. Each option requires a separate license file.

Before you begin

These instructions do not pertain to options that were purchased and pre-installed on your instrument when ordered.

A node-locked license is valid only for the specific model number and serial number of the instrument for which it was purchased; it will not work on any other instrument. The single license file does not affect options that were factory installed or any other upgrades that you may have already purchased and installed.

About this task

Note:You can only install a Node Locked option license one time. If you need to reinstall an uninstalled Node Locked license, contact Tektronix Customer Support.

Procedure

  1. Follow the instructions you received to download the upgrade license file (<filename>.lic).
  2. Copy the license file or files to a USB memory device.
  3. Insert the USB drive into the powered-on oscilloscope for which the upgrade was purchased.
  4. Select Help > About.
  5. Select Install License to open the Browse License Files dialog box.
  6. Find and select the upgrade license file to install.
  7. Select Open. The oscilloscope installs the license and returns to the About screen. Verify that the installed license was added to the Installed Options list.
  8. Repeat steps 5 through 7 for each upgrade license file that you purchased and downloaded.
  9. Power cycle the oscilloscope to enable the installed upgrades.
  10. If you installed a bandwidth upgrade, rerun signal path compensation (SPC). Then carefully remove the model/bandwidth label from the lower-left corner of the front panel and install the new model/bandwidth label that was sent through normal mail channels as part of the upgrade purchase.

Operating requirements

Use the instrument within the required operating temperature, power, altitude, and signal input voltage ranges to provide the most accurate measurements and safe instrument operation.

Table 1. Environment requirements
Characteristic Description
TemperatureOperating instrument: 0°C to +50°C (+32°F to 120°F), with 5 °C/minute maximum gradient, noncondensing (NC)
Operating with battery: 0 °C to 45 °C (+32 °F to 113 °F)
For proper cooling, keep the rear of the instrument clear of obstructions for 2 inches (51 mm).
Operating humidity 5% to 90% relative humidity at temperatures up to +30°C,
5% to 60% relative humidity at temperatures greater than +30°C and up to +50°C.
Operating altitude Up to 3000 meters (9842 feet)
Battery powerRequires 2-BATPK battery pack with 2 slots for batteries to be ordered with instrument or 2-BP battery pack with 2 slots for batteries to be ordered post instrument purchase
Supports up to 2 TEKBAT-XX Li-Ion rechargeable batteries. Operating time; Up to 3 hours single battery and up to 6 hours dual batteries.
Tektronix recommends using the TEKCHG-XX external battery charger to charge the TEKBAT-XX batteries in ambient environments greater than +30°C.
Table 2. Power requirements
Characteristic Description
Power source voltage 24 V DC
Power source current 2.5 A

Input signal requirements

Keep the input signals within allowed limits to ensure the most accurate measurements and prevent damage to the analog and digital probes or instrument.

Make sure that input signals connected to the instrument are within the following requirements.

Input Description
Analog input channels and AUX In, 1 MΩ setting, maximum input voltage at BNC 300 VRMS
Measurement Category II
Digital input channels, maximum input voltage range at digital inputs Observe probe ratings
P6316 Logic Probe

Check that the instrument passes power-on self tests

Power-on self tests verify that all instrument modules are working correctly after power up.

Procedure

  1. Power on the instrument and wait until the instrument screen appears.
  2. Select Utility > Self Test from the top-edge Menu bar to open the Self Test configuration menu.
  3. Check that the status of all power-on self tests are Passed.
If one or more power-on self tests shows Failed:
  1. Power cycle the instrument.
  2. Select Utility > Self Test. If one or more power-on self tests still shows Failed, contact Tektronix Customer Support.

Battery pack information

The battery pack allows you to perform measurements without relying on AC power. All 2 Series MSO instruments support the installation of the battery pack.

You can operate the instrument continuously for approximately three hours with one battery and six hours with two batteries in the battery pack. The instrument turns off automatically when the batteries run out of power. An on-screen icon and battery status menu indicates the remaining battery power.

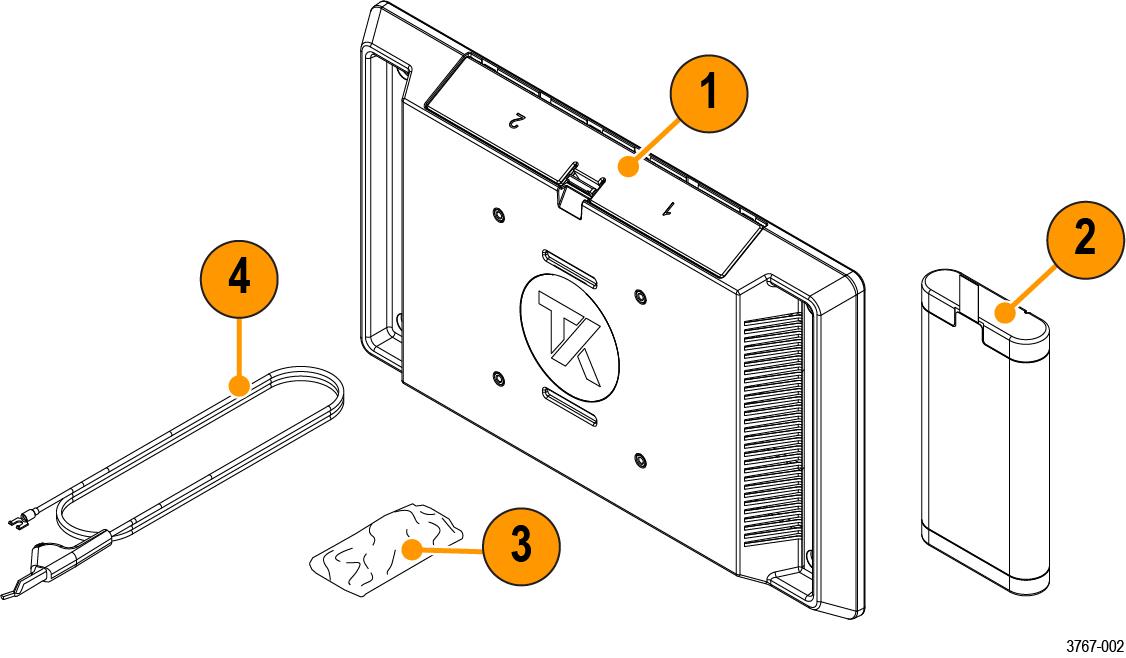
Parts list

ItemPart NumberDescription
12-BP2 Series MSO Battery Pack with two battery slots; ordered separate from instrument purchase.
2-BATPK2 Series MSO Battery Pack with two battery slots; option ordered with instrument purchase.
2TEKBAT-XXBattery; lithium-ion, rechargeable, SMBUS, recessed terminals, UL, safety controlled
3211-1722-XXPack of 4 screws, M4X.7X12MM
4174-7369-XXGround cable, safety controlled


Recommended installation tools

Use a screwdriver handle with No. 2 Phillips screw tip or a No. 2 Phillips screwdriver to install the battery pack onto your instrument.

Battery pack installation

Install the battery pack to the back of your instrument.

Before you begin

The battery pack must be empty during the installation procedure. After installation, insert one or two batteries into the battery pack before you turn on the instrument.
CAUTION:The battery interface connector is susceptible to Electrostatic Discharge (ESD). Use ESD precautions with installing or removing the battery pack.
WARNING:Before operating the instrument with the battery pack connected without an AC power source, always connect the ground cable.

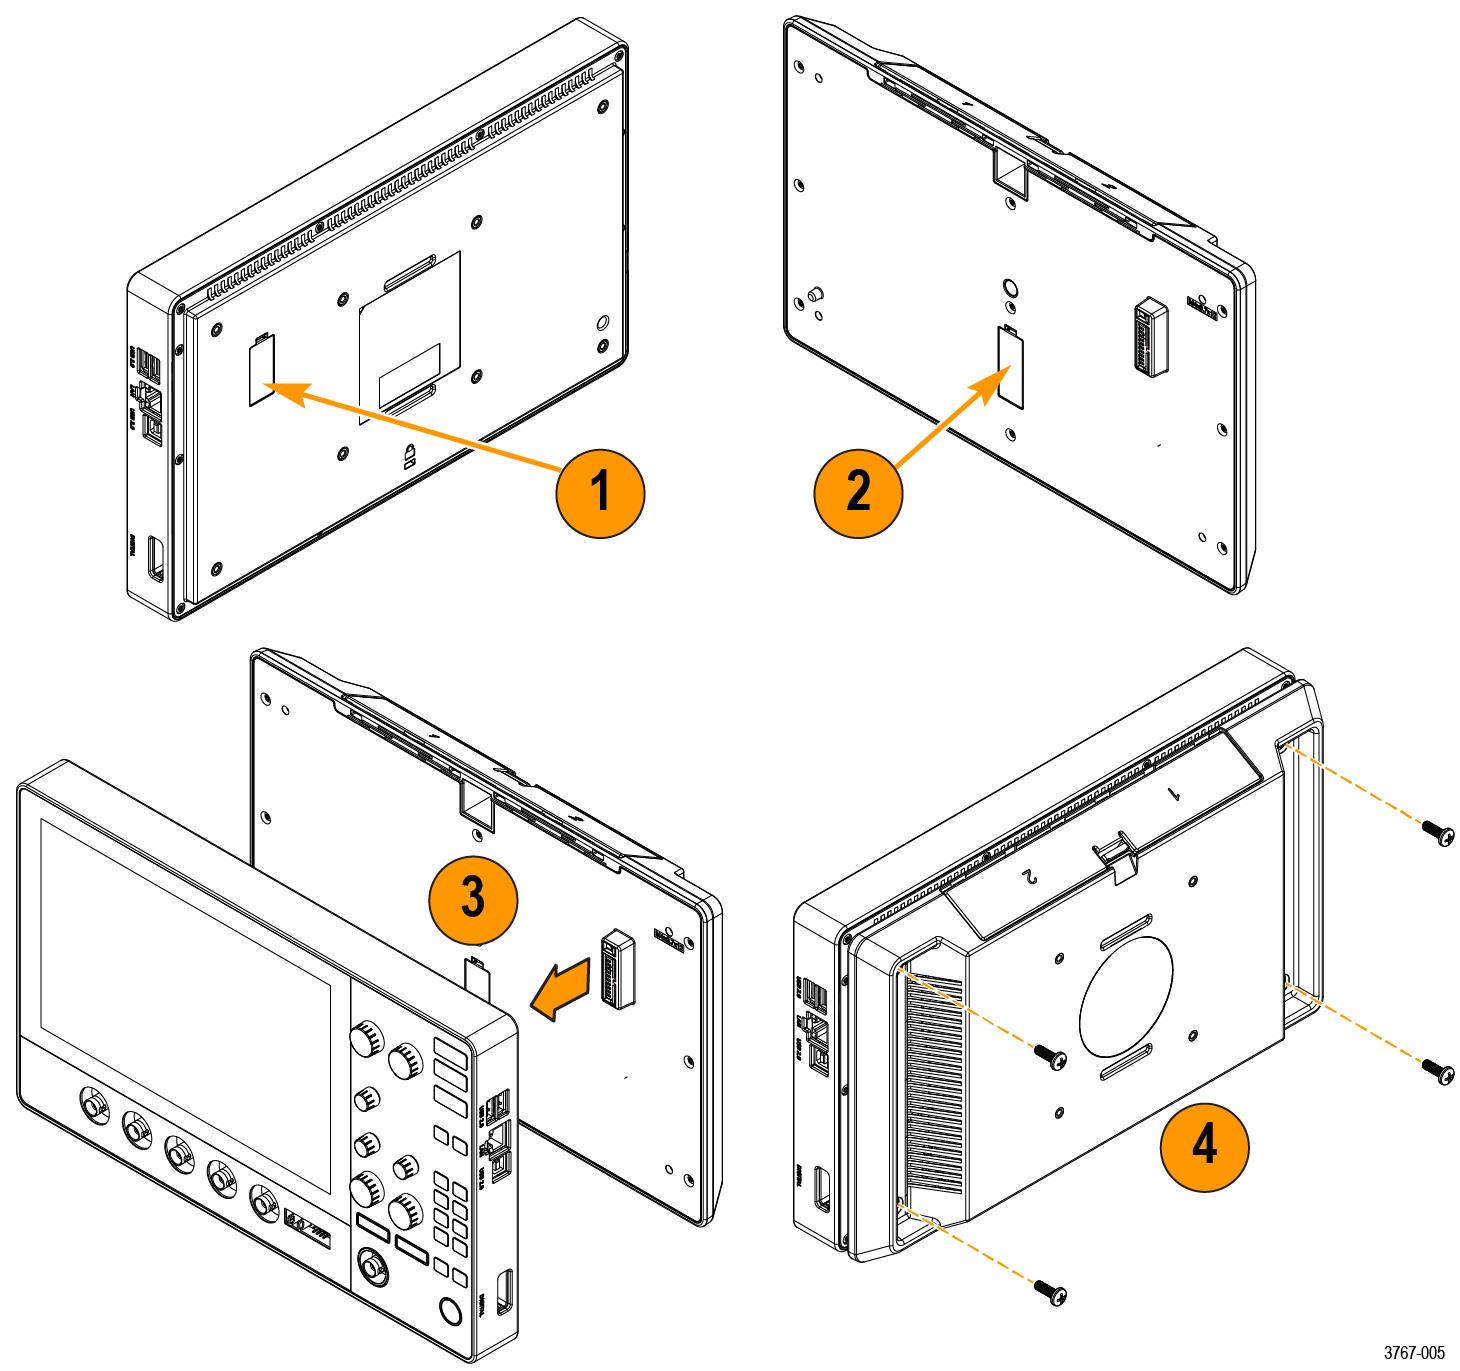
Procedure

  1. Remove cover from battery interface connector on the back of your instrument.
  2. Attach the battery interface cover to the cover slot in the middle of the battery pack.
    Use this slot to save the cover for the battery interface connector when the battery pack is installed.
  3. Align the connector on your battery pack with the battery interface connector on your instrument and connect the battery pack to your instrument.
    There is a hole on the opposite side of the connector on the instrument and a peg on the battery pack to help with alignment.
  4. Install the four provided screws into the corner screw mounts on the battery pack.
    CAUTION:The recommended torque is 3.6 N·m (32 inch-lbf). Failure to fully tighten the screws makes the battery pack more susceptible to fall damage.
    To remove the battery pack, reverse this procedure.

Operating safely with battery power

For safe operation, the instrument chassis should always remain at earth ground potential.

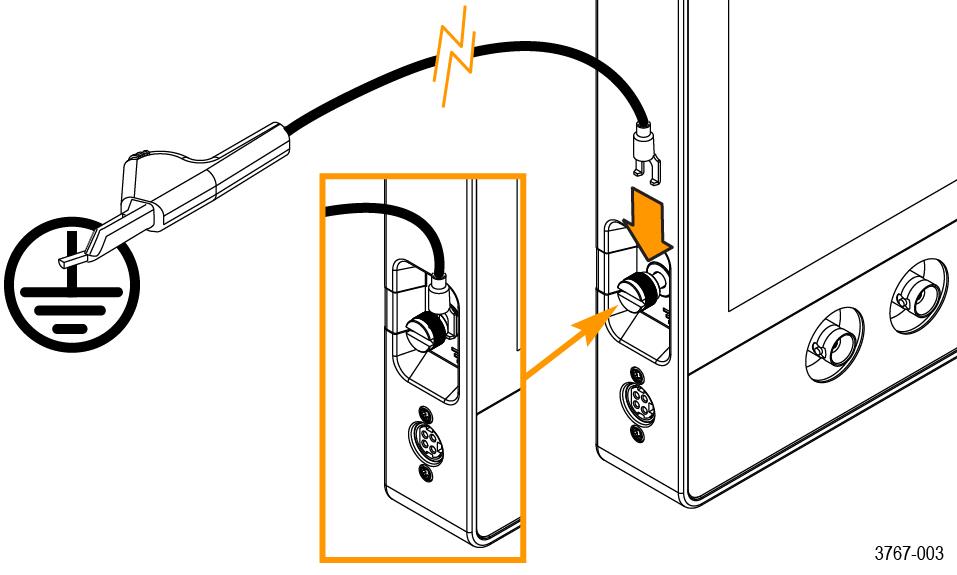
WARNING:To avoid electric shock, always use the Tektronix-provided grounding cable when the oscilloscope is operating on battery power and not connected to the external power supply. The Tektronix-provided grounding cable is not for permanent usage.

Without a connection between the chassis and earth ground, you may receive a shock from exposed metal on the chassis if you connect an input to a hazardous voltage (>30 VRMS, >42 Vpk). To protect yourself against possible shock, attach the Tektronix-provided grounding cable.

The grounding cable is necessary to provide protective bonding between the oscilloscope and a dedicated earthing terminal, in accordance with the NEC, CEC, and local codes. Consider having a qualified electrician to approve the installation.

The grounding cable shall be connected before powering on the oscilloscope and before attaching the probes to any circuit. Connect the grounding cable from the ground lug terminal on the side panel of the instrument to a dedicated earthing terminal. Make sure the teeth of the alligator clip makes good electrical contact and is secured against slipping.

The alligator clip on the grounding cable must be connected to a dedicated earthing terminal, an earthing terminal bar, or identified equipment grounding points (a rack cabinet for example). Make sure you have a good electrical connection to an appropriate grounding device that is identified with a Protective Earth symbol, or the word GROUND/GND, or the color green (green ground screw/conductor). If none of these are present, assume the connection is not earthed.


Always verify that the grounding cable is making good electrical contact by using an ohmmeter or continuity meter between the dedicated earthing terminal and the ground lug terminal on the side panel of the oscilloscope. Verify again anytime the oscilloscope has been left unattended.

Make sure the dedicated earthing terminal is located in close proximity to the circuit under test. Keep the grounding cable clear of heat sources and mechanical hazards such as; sharp edges, screw threads, moving parts, and closing doors/covers. Inspect the cable, insulation, and terminal ends for damage before use. Do not use a damaged grounding cable. Contact Tektronix for a replacement.

If you choose not to attach the grounding cable, you are not protected against electric shock if you connect the oscilloscope to a hazardous voltage. You can still use the oscilloscope if you do not connect a signal greater than 30 VRMS (42 Vpk) to the probe tip, the BNC connector center, or the common lead. Make sure all probe common leads are connected to the same voltage.

WARNING:Hazardous voltages may exist in unexpected places due to faulty circuitry in the device under test.
CAUTION:When operating the instrument on battery power do not connect a grounded device, such as a printer or computer, to the oscilloscope unless the instrument grounding cable is connected to the earth ground.

Rechargeable battery installation

The battery pack has 2 battery slots and supports hot swapping of the batteries during operation to extend the battery run time. The batteries are charged when the instrument is connected to an AC power source or charge each battery separately using the Tektronix external battery charger (TEKCHG-XX).

Procedure


  1. Use your fingers to push on the battery door latch and open the door upward.
    The battery door is made to easily detach from the hinges. The battery pack will still operate with the door open or removed.
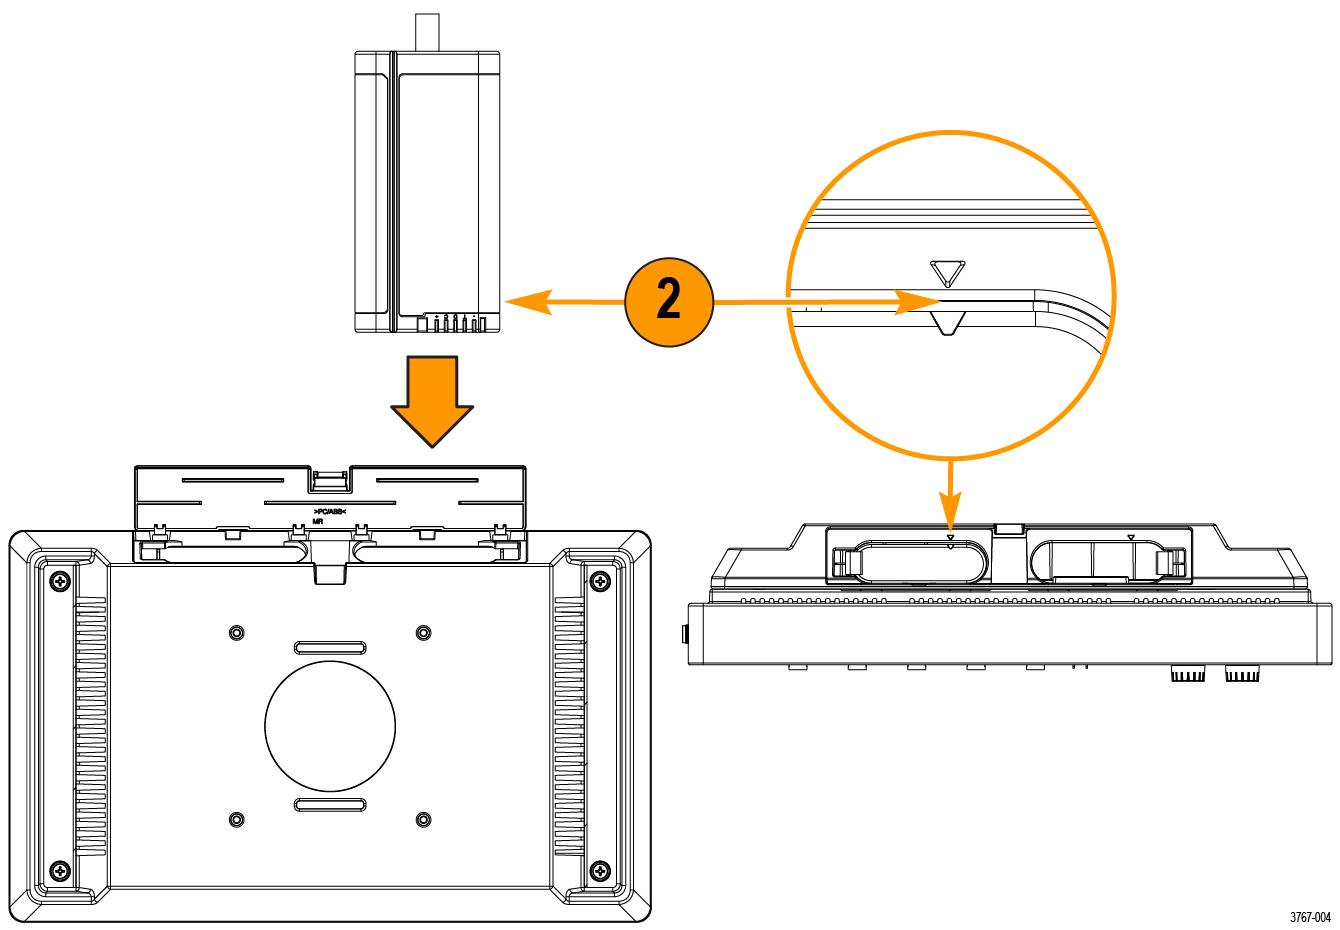
  2. Use the triangle alignment keys on top of the battery and battery pack slot to place the rechargeable battery into slot one or two.
    The pull tab will be on the opposite side of the alignment key. A latch secures the battery in place when inserted into the battery pack.
  3. Close and latch the battery pack door.

Rechargeable battery removal

Procedure


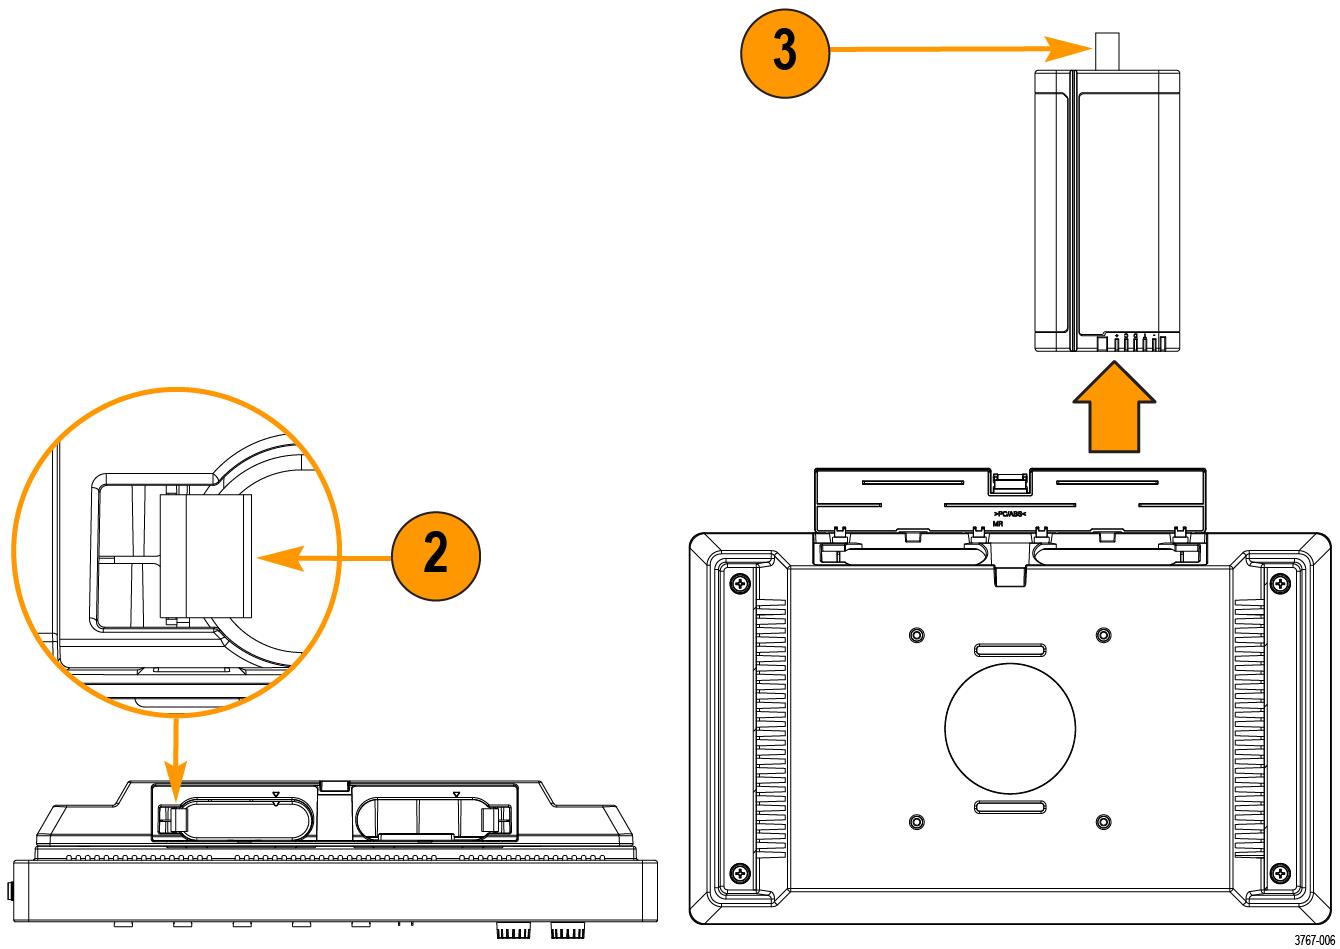
  1. Use your fingers to push on the door latch and open the door upward.
  2. Open the battery latch to release the battery from the slot.
  3. Use the battery pull tab to remove the battery from the slot.
  4. Close and latch the battery pack door.

Battery status

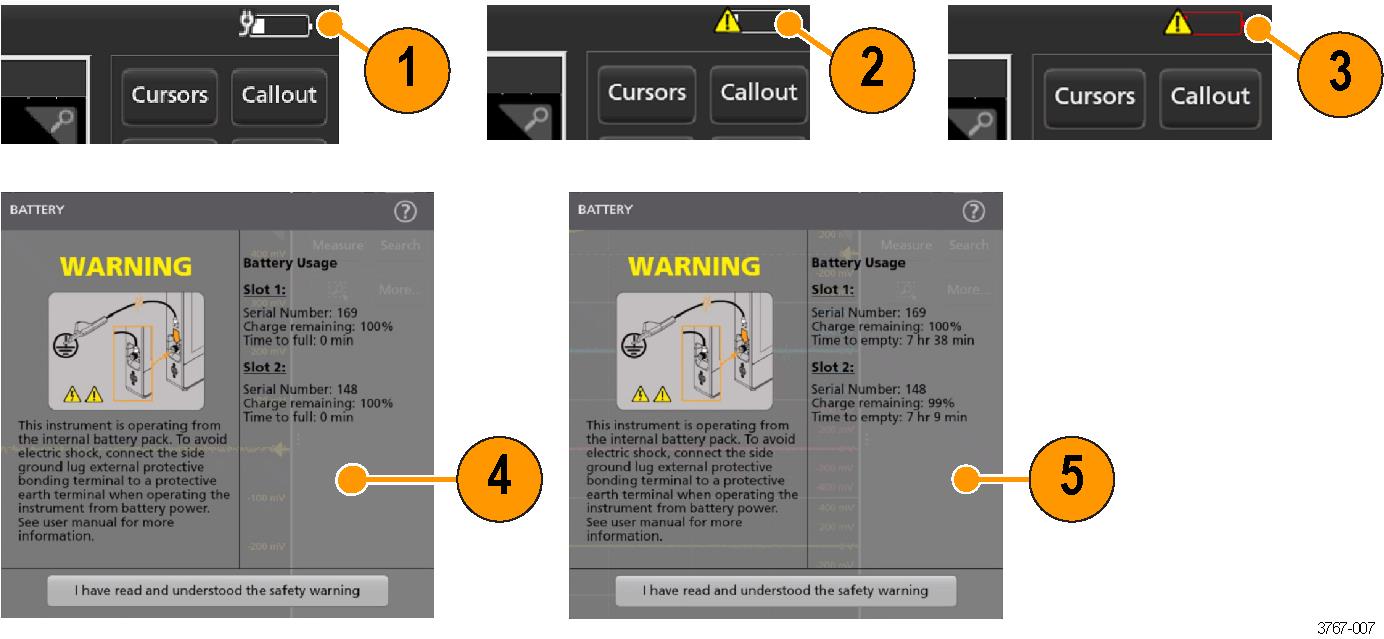
When the battery pack is installed and a battery is inserted, an icon and battery menu indicates the battery status.

The battery icon is displayed in the upper right corner of the screen. Double tapping the icon opens the battery menu. The battery menu indicates whether a battery has been inserted in slot 1 or 2, the battery serial number, a remaining charge percentage, and the battery time to full or empty.

A safety warning message automatically displays in the battery menu when an instrument is turned on with battery power only or when the power cord is removed from an instrument operating on battery power. You must tap the safety warning acknowledgement button to close the battery menu.

The following table and images describe the different icon states, Time to full, and Time to empty.

ItemDescription
1The battery icon displays a power cord when connected to an AC power source. This indicates that the battery is charging in the battery pack.
2The battery icon and a warning symbol when operating on a battery power alone.
3The battery icon turns red when less than ten percent of the battery charge is remaining.
4Time to full displays the time it takes for the battery fully charge when connected to an AC power source.
5Time to empty displays the remaining time until the battery is empty. It is only displayed when operating on battery power alone.

When the batteries in the 2-BP battery pack on your instrument have a low battery charge and the power cord is not connected, the power button will blink twice and then your instrument will turn off.

When two batteries are inserted into the 2-BP battery pack, the battery with the lowest battery life will begin charging first. The battery with the higher battery life displays a long Time to Full when it is not actively charging. The two batteries actively charge at the same rate when they reach a similar battery life. When both batteries are actively charging the Time to Full display accurately.

Instrument stand to battery pack installation

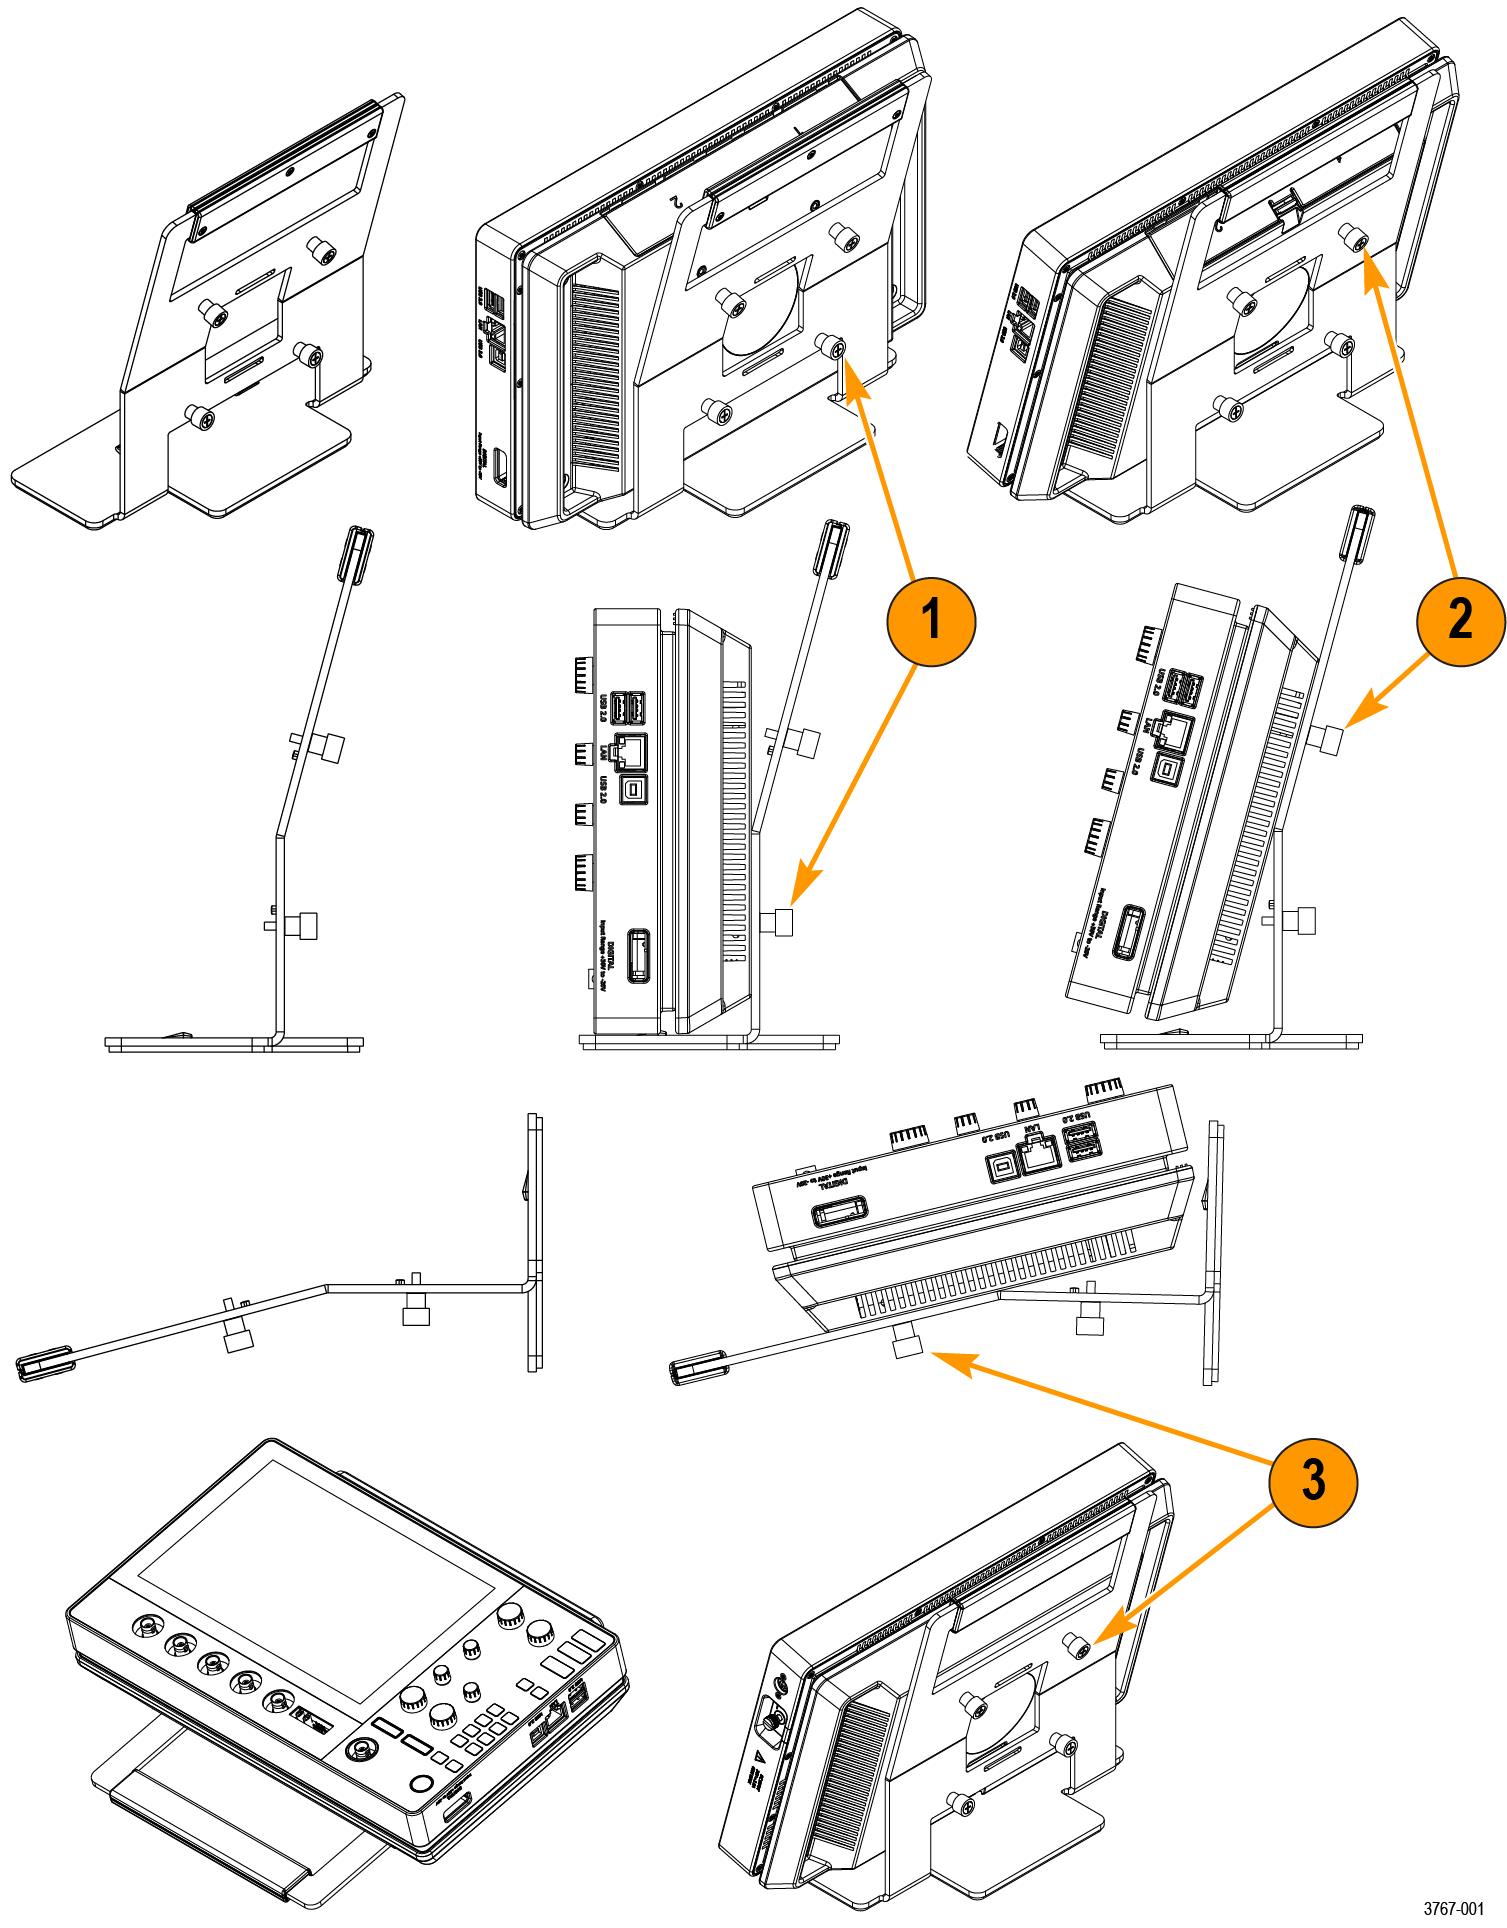
Mount your instrument to the provided stand in three configurations.

Before you begin

Align the stand with the four VESA screw mounts (closest to the label) on the back of the battery pack.

Procedure


  1. Hand tighten the bottom two screws on the stand to the bottom two VESA screw mounts.
    The instrument is now secured to the stand straight up and down.
  2. Hand tighten the top two screws on the stand to the top two VESA screw mounts.
    The instrument is now secured to the stand at a fifteen degree angle.
  3. Turn the instrument upside-down and hand tighten the top two screws on the stand to the bottom two VESA screw mounts.
    The instrument is now secured to the stand at a seventy-five degree angle when the stand is laying flat.

Connecting probes to the instrument

Probes connect the instrument to your device under test (DUT). Use a probe that best matches your signal measurement needs.

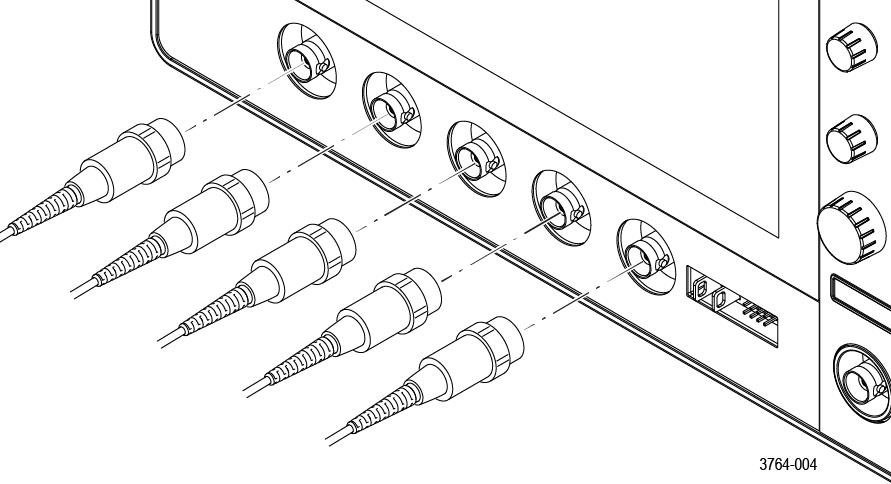
Connect a BNC passive probe or cable by pushing it onto a channel BNC bayonet connector and turn the lock mechanism clockwise until it locks.

Rackmount option information

An optional rackmount kit lets you install the oscilloscope in standard equipment racks.

Please refer to the product datasheet at tek.com for information on rackmount options.

Getting acquainted with your instrument

The following content provides a high-level description of the instrument controls and user interface.

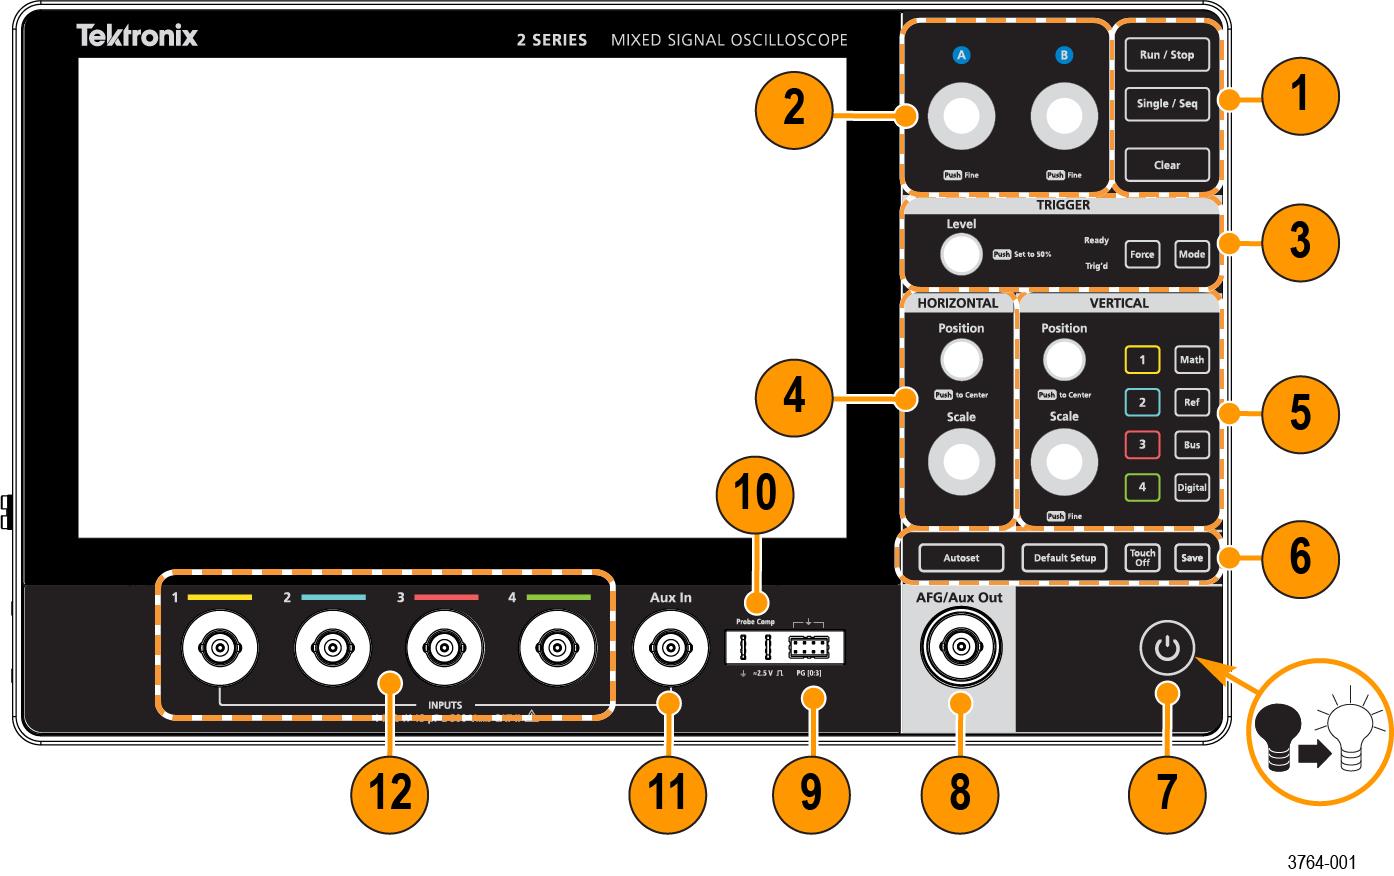
Front panel controls and connectors

The front panel controls provide direct access to key instrument settings such as vertical, horizontal, trigger, cursors, and zoom. The connectors are where you input signals with probes or cables.


Description
1Use the Acquisition controls to start and stop waveform acquisition, enable making a single waveform acquisition, calculate the average of all the samples for each acquisition interval, and delete the current acquisitions and measurement values from memory.
2Use the Multipurpose Knobs (A, B) to move cursors, adjust the zoom, and set parameter values in configuration menu input fields.
3Use the Trigger controls to force a trigger event at a random point in the waveform and capture the acquisition, set the amplitude level that the signal must pass through to be considered a valid transition, and set how the instrument behaves in the absence or presence of a trigger event.
4Use the Horizontal controls to move the waveform from side to side on the screen, and set the time per major horizontal graticule division and samples/second parameters for the oscilloscope.
5Use the Vertical controls to move the selected waveform up or down on the screen, set the amplitude units per vertical graticule division of the selected waveform, turn on (display) or select channels, and add or select a math, reference (saved), bus, and digital waveform on the Waveform view.
6Use the Miscellaneous controls to turn touchscreen capability off, restore the oscilloscope settings to the default settings, automatically display a stable waveform, and save files or settings (using the current File > Save As settings).
7After connecting the supplied power cord, use the power button to power the instrument on and off. The power button color indicates the following instrument states; amber is standby, blue is on, unlit is off.

When the batteries in the 2-BP battery pack on your instrument have a low battery charge and the power cord is not connected, the power button will blink twice and then your instrument will turn off.

Note:Always allow 10 seconds between power down and power up of the instrument before operating the instrument.
8The AFG/AUX Out BNC connector is multiplexed. You must select either AFG or Aux Out to use this connector.

AFG is the signal output for the optional Arbitrary Function Generator (AFG) feature. AUX Out generates a signal transition on a trigger event or outputs a synchronization signal from the AFG.

9Pattern Generator (PG) is a signal output for four Digital signals.
Note:Wait until the instrument has completed the power on process before connecting to the PG connector. Disconnect from the PG connector before powering the instrument down.
10Use Ground and probe compensation connectors to provide a ground connector to help reduce electrostatic damage (ESD) and adjust the high-frequency response of a passive probe.
11Auxiliary trigger input (Aux in) is a connector to which you can connect an external trigger input signal. Use the Aux In trigger signal with the Edge trigger mode.
12Use the Probe connectors to connect BNC passive probes and BNC cables.

Button and knob functions

A description of the functionality of each button and knob on your instrument.

ButtonDescription
Run/StopStarts and stops waveform acquisition. The button color indicates the acquisition status (green indicates running and acquiring; red indicates stopped). When stopped, the oscilloscope shows waveforms from the last completed acquisition. The Run/Stop button on the screen also shows the acquisition status.
Single/SeqEnables making a single waveform acquisition, or a specified number of acquisitions (as set in the Acquisition configuration menu). Pushing Single/Seq turns off Run/Stop mode and takes a single acquisition. The button color indicates the acquisition status (quick green flash indicates single acquisition acquired; solid green indicates waiting for trigger event). Pushing Single/Seq again takes another single acquisition.
ClearDeletes the current acquisitions and measurement values from memory.
A and B knobsThe multipurpose knobs A and B move cursors and set parameter values in configuration menu input fields. Selecting an menu field that can use a multipurpose knob assigns the indicated knob to change the value in that input field. The ring around each knob lights when you can use that knob to do an action. Push a multipurpose knob to enable the Fine mode for making smaller increment changes. Push the knob again to close Fine mode.
ForceForces a trigger event at a random point in the waveform and captures the acquisition.
LevelSets the amplitude level that the signal must pass through to be considered a valid transition. The color of the Level knob LED indicates the trigger source except for dual-level triggers. The Level knob is not available when the trigger type requires two level settings or other trigger qualifiers (set from the Trigger configuration menu). Push the knob to set the threshold level to 50% of the peak-to-peak amplitude range of the signal.
ModeSets how the instrument behaves in the absence or presence of a trigger event.
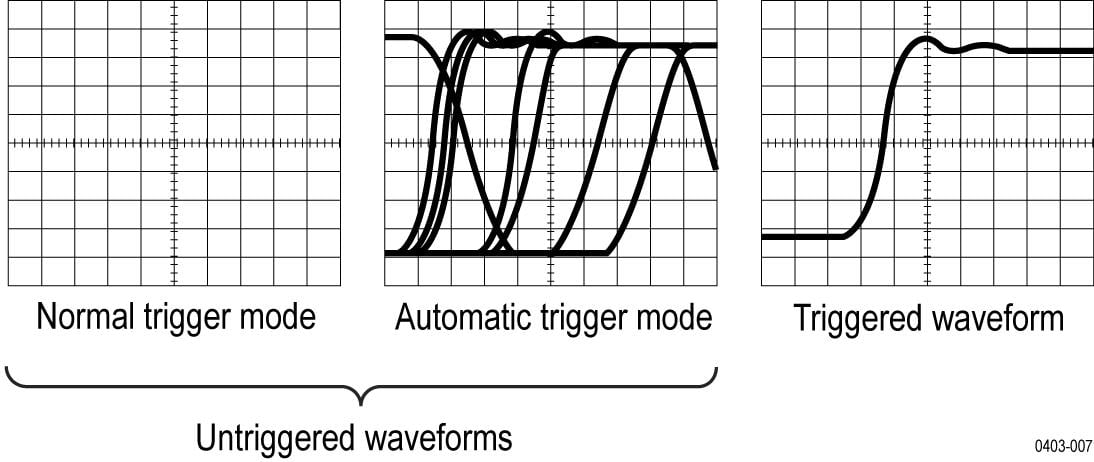
Auto trigger mode enables the instrument to acquire and display a waveform whether or not a trigger event occurs. If a trigger event occurs, the instrument displays a stable waveform. If a trigger event does not occur, the instrument forces a trigger event and acquisition and displays an unstable waveform.
Normal trigger mode sets the instrument to acquire and display a waveform only when there is a valid trigger event. If no trigger occurs, the last waveform record acquired remains on the display. If no last waveform exists, no waveform is displayed.
Horizontal PositionMoves the waveform and graticule side to side on the screen (changing the trigger point position in the waveform record). Push the knob to center the trigger event to the center graticule on the Waveform view.
Horizontal ScaleSets the time per major horizontal graticule division and samples/second parameters for the oscilloscope. Scale applies to all waveforms. Push the knob to enable the Fine mode for making smaller increment changes. Push the knob again to close Fine mode.
Vertical PositionMoves the selected waveform (Channel, Math, Reference, Bus) and its graticule up or down on the screen. The color of the knob indicates which waveform the knob is controlling. Push the knob to set the threshold level to 50% of the peak-to-peak amplitude range of the signal.
Vertical ScaleSets the amplitude units per vertical graticule division of the selected waveform. The scale values are shown on the right edge of the horizontal graticule lines, and are specific to the selected waveform in both Stacked or Overlay modes (in other words, each waveform has its own unique vertical graticule settings regardless of display mode). The color of the knob indicates which waveform the knob is controlling.
Channel buttonsTurn on (display), select, or turn off Channel, Math, Reference, or Bus waveforms. The number of channel buttons depends on the instrument model. If the channel is not displayed, pushing a Channel button turns on that channel to the Waveform view. If the channel is on the screen and is not selected, pushing that channel's button selects that channel. If the channel is on the screen and is also selected, pushing that channel's button turns that channel off (removes it from Waveform view).
MathAdds or selects a Math waveform on the Waveform view. If no Math waveform exists, pushing the Math button adds a Math waveform to the Waveform view and opens the Math configuration menu. If only one Math waveform is displayed, pushing the button turns off the Math waveform (removes it from Waveform view). Push the button again to display the waveform. If two or more Math waveforms are displayed, pushing the button cycles through selecting each math waveform.
RefAdds or selects a Reference (saved) waveform on the Waveform view. If no Reference waveform exists, pushing the button opens the Browse Waveform Files configuration menu. Navigate to and select a waveform file (*.wfm) and tap Recall to load and display the reference waveform. If only one Reference waveform is displayed, pushing the button turns off the Reference waveform (removes it from the Waveform View). Push the button again to display the waveform. If two or more Reference waveforms are displayed, pushing the button cycles through selecting each Reference waveform.
BusAdds or selects a bus waveform on the Waveform view. If no Bus waveform exists, pushing the button adds a Bus waveform to the Waveform view and opens the Bus configuration menu. If only one Bus waveform is displayed, pushing the button turns off the Bus waveform (removes it from Waveform view). If two or more Bus waveforms are displayed, pushing the button cycles through selecting each Bus waveform.
DigitalAdds or selects a digital waveform on the Waveform view. If no digital waveform exists, pushing the button adds a digital waveform to the Waveform view and opens the digital configuration menu. If only one digital waveform is displayed, pushing the button turns off the digital waveform (removes it from Waveform view). If two or more digital waveforms are displayed, pushing the button cycles through selecting each digital waveform.
AutosetAutomatically displays a stable waveform.
Default SetupRestores the oscilloscope settings (such as; horizontal, vertical, scale, position) to the factory default settings.
Touch OffTurns touch screen capability off. The button is lighted when the touch screen is turned off.
SaveSave is a one-push save operation that uses the current File > Save As settings to save screen-shots (including open menus and dialog boxes), waveform files, instrument settings. If a File > Save or File > Save As operation has occurred since the last instrument start-up, pushing the button saves the file types to the location last set in the Save As configuration menu. If no file save operation has occurred since the last instrument start-up, pushing the button opens the Save As configuration menu. Select a tab to choose the type of file to save (such as; Screen Capture and Waveform), set any associated parameters, and where to save it, and select OK. The specified file or files are saved. The next time you push the button, the same type files are saved. Screen Captures save the entire screen, including most displayed configuration menus and dialog boxes.

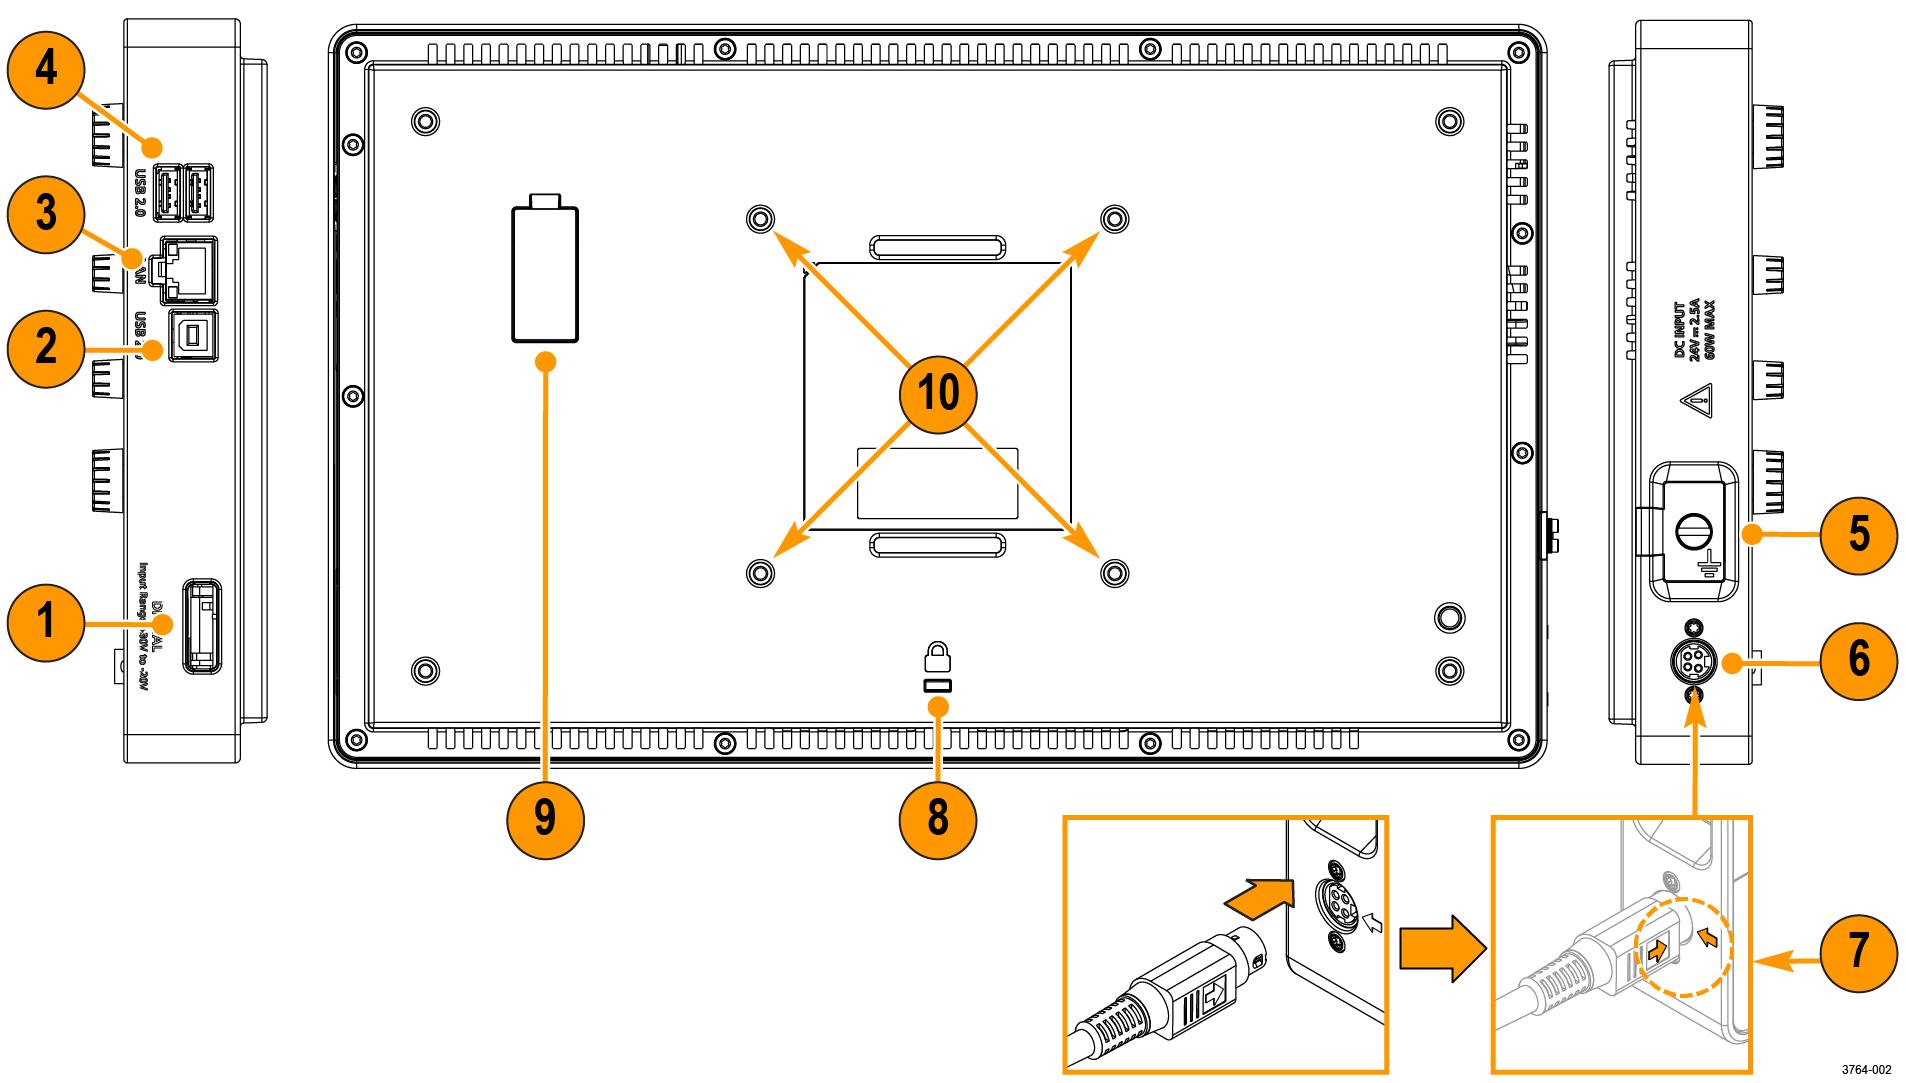
Rear and side panel connections

The rear and side panel connections supply power to the instrument and provide connectors for network, USB devices, digital probes, battery pack, and instrument stand.


Description
1Use the digital probe connector to connect the P6316 Logic Probe.
2Use the USB Device port to connect to a PC to remotely control the oscilloscope using the USBTMC protocol.
3Use the LAN connector (RJ-45) to connect the oscilloscope to a 10/100 Base-T local area network.
4Use the two USB Host ports to connect a USB memory device, keyboard, or mouse
5The ground lug external chassis ground point allows you to connect your instrument chassis to a ground reference. Use the ground lug when the instrument is operating on power from the optional battery pack accessory. Attach an anti-static wrist strap to the ground lug to reduce electrostatic damage (ESD) while you handle or probe the DUT.
6To power the instrument, connect the supplied power cord to the power connector slot on the side of the instrument. Then connect the power cord to the appropriate AC mains source and use the power button. Use only the power cord specified for this product and certified for the country of use.

To completely remove power from the instrument, disconnect the power cord. Use the power cord latch when removing the power cord from the power connector.

7The power cord has a high force, latching connector to secure the power cord in place. Align the arrow on the latch with the arrow next to the connector. Push the latch in until the connector is fully seated.

Hold onto the power cord latch and move it away from the power connector slot to disconnect the power cord.

8Use the security lock connector to secure the oscilloscope to a work bench or other location with a standard PC/laptop lock cable.
9Use the battery interface connector to connect the external battery pack to the instrument. See the instructions that come with the battery pack for more information.
CAUTION:The battery interface connector is susceptible to Electrostatic Discharge (ESD). Use ESD precautions with installing or removing the battery pack.
10Use the VESA mount (100mm x 100mm) screws to mount your instrument to the supplied stand or other compatible VESA accessories.

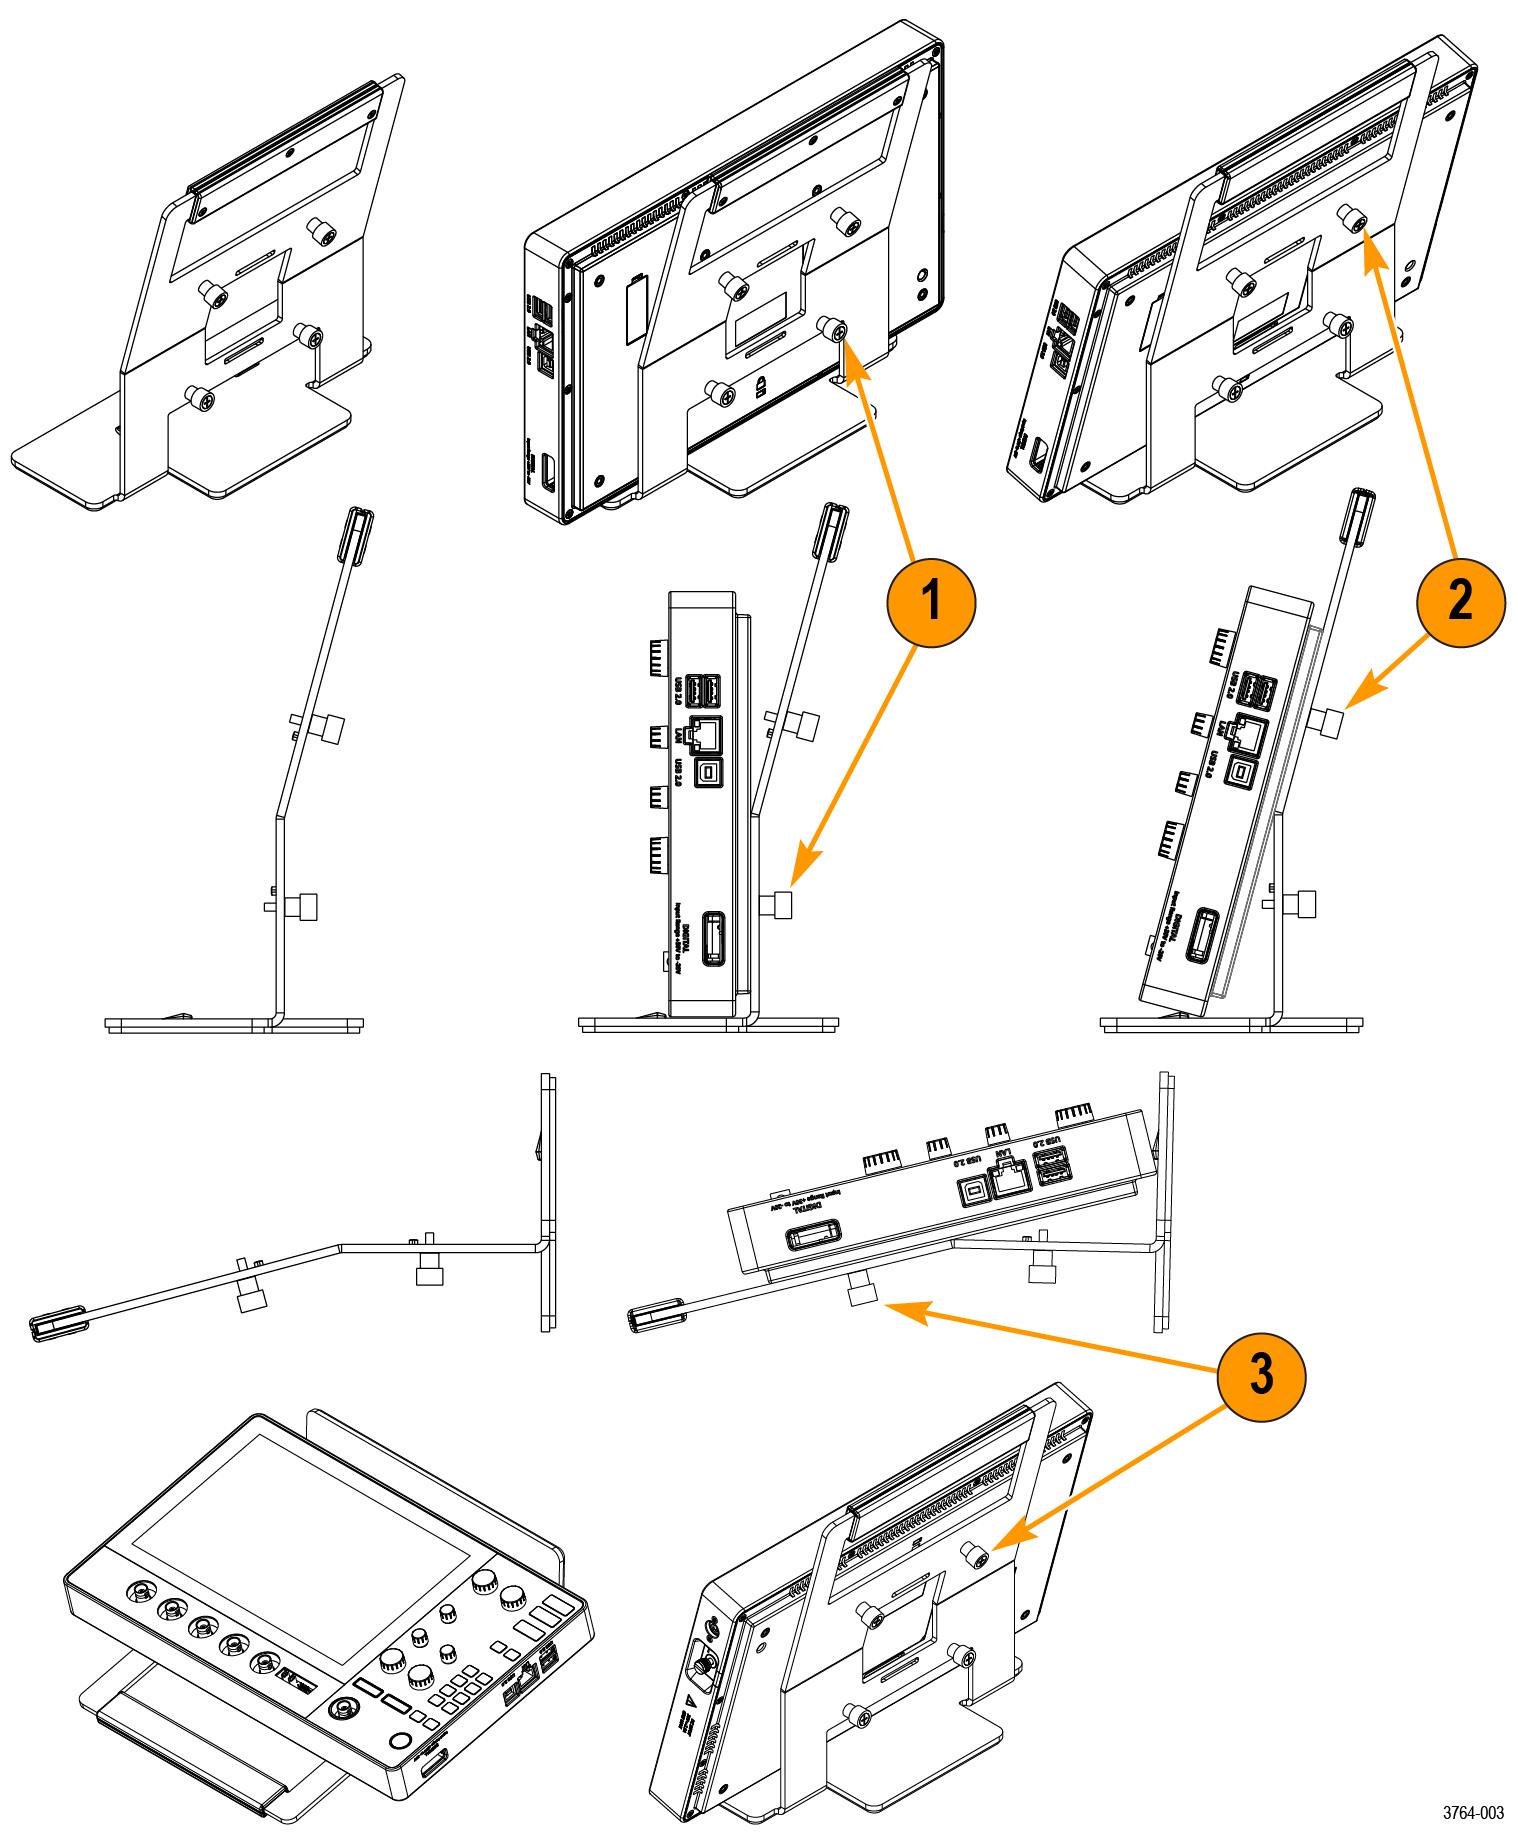
Instrument stand installation

Mount your instrument to the provided stand in three configurations.

Before you begin

Align the stand with the four VESA screw mounts (closest to the label) on the back of the instrument.

Procedure


  1. Hand tighten the bottom two screws on the stand to the bottom two VESA screw mounts.
    The instrument is now secured to the stand straight up and down.
  2. Hand tighten the top two screws on the stand to the top two VESA screw mounts.
    The instrument is now secured to the stand at a fifteen degree angle.
  3. Turn the instrument upside-down and hand tighten the top two screws on the stand to the bottom two VESA screw mounts.
    The instrument is now secured to the stand at a seventy-five degree angle when the stand is laying flat.

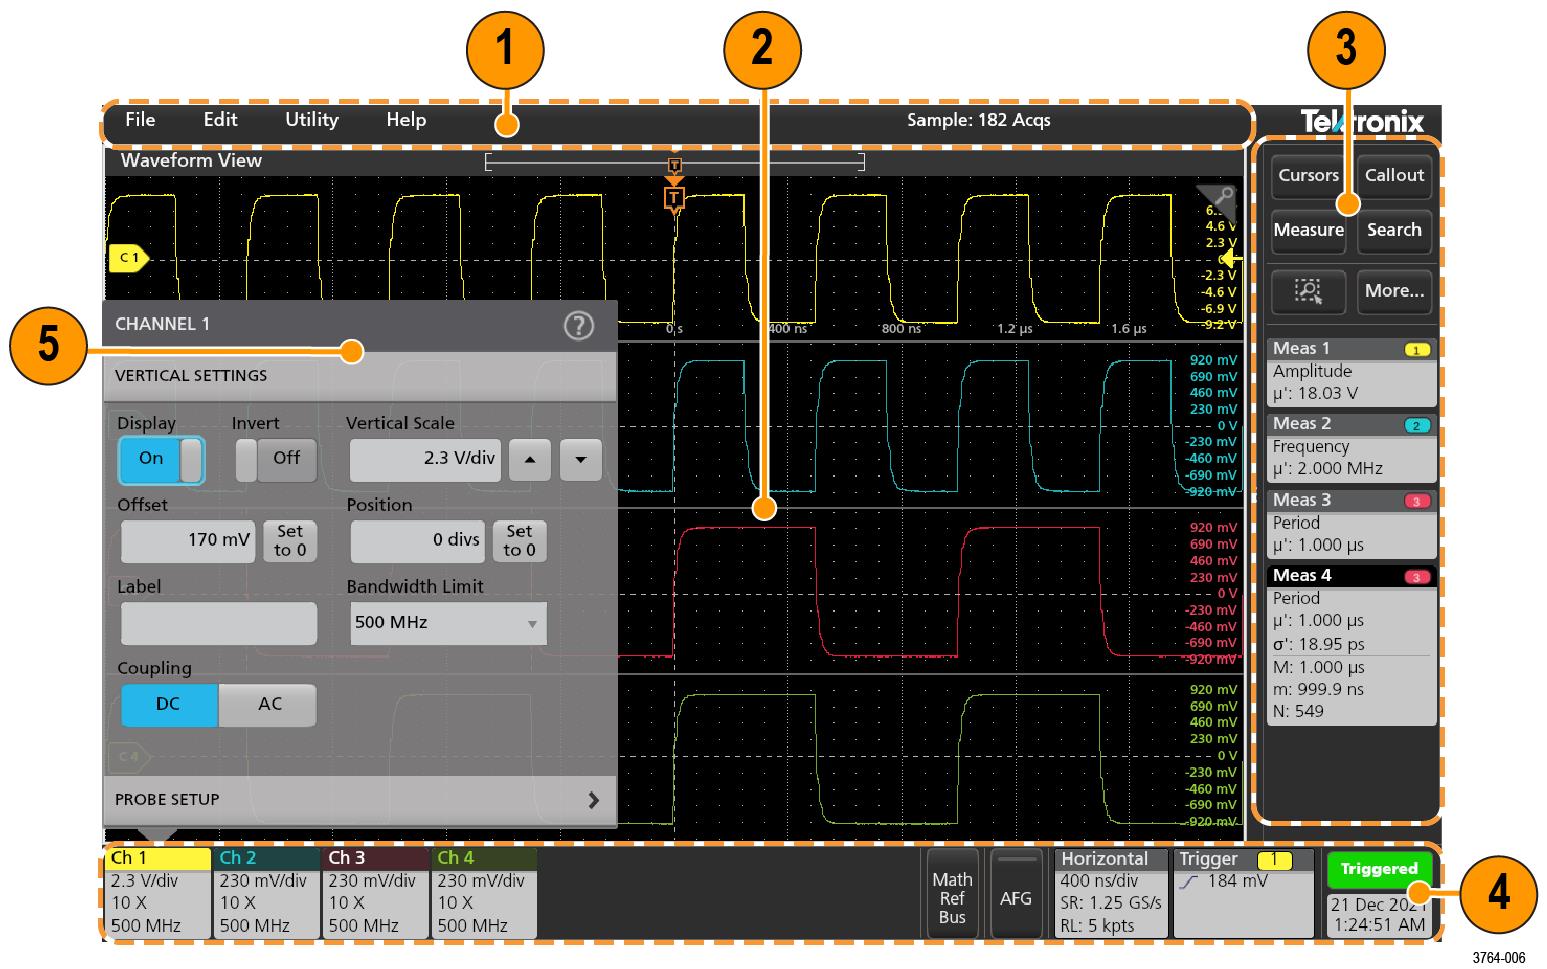
User interface

The touch screen user interface contains waveforms and plots, measurement readouts, and touch-based controls to access all oscilloscope functions.


Description
1The menu bar provides menus for typical operations including:
Saving, loading, and accessing files
Undoing or redoing an action
Setting oscilloscope display and measurement preferences
Configuring network access
Running self tests
Erasing measurement and settings memory
Loading option licenses
Opening a Help viewer
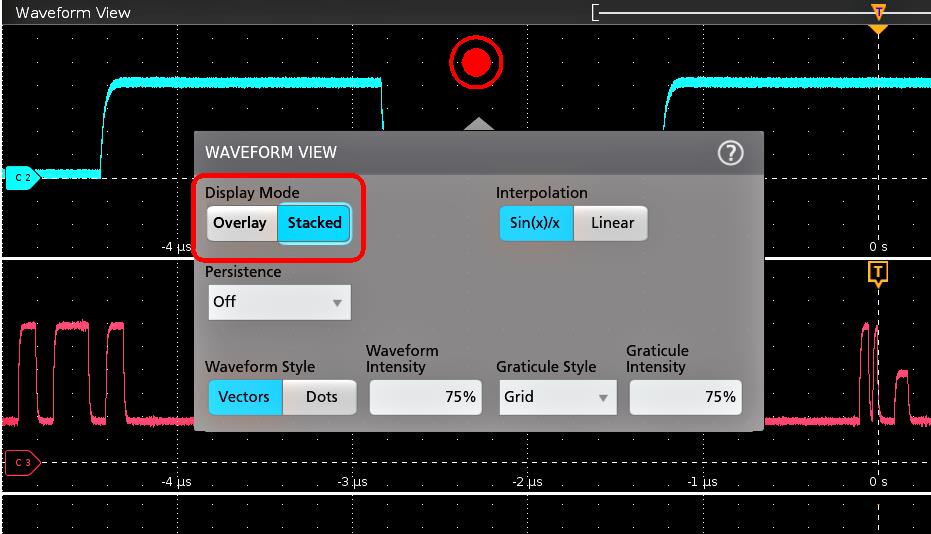
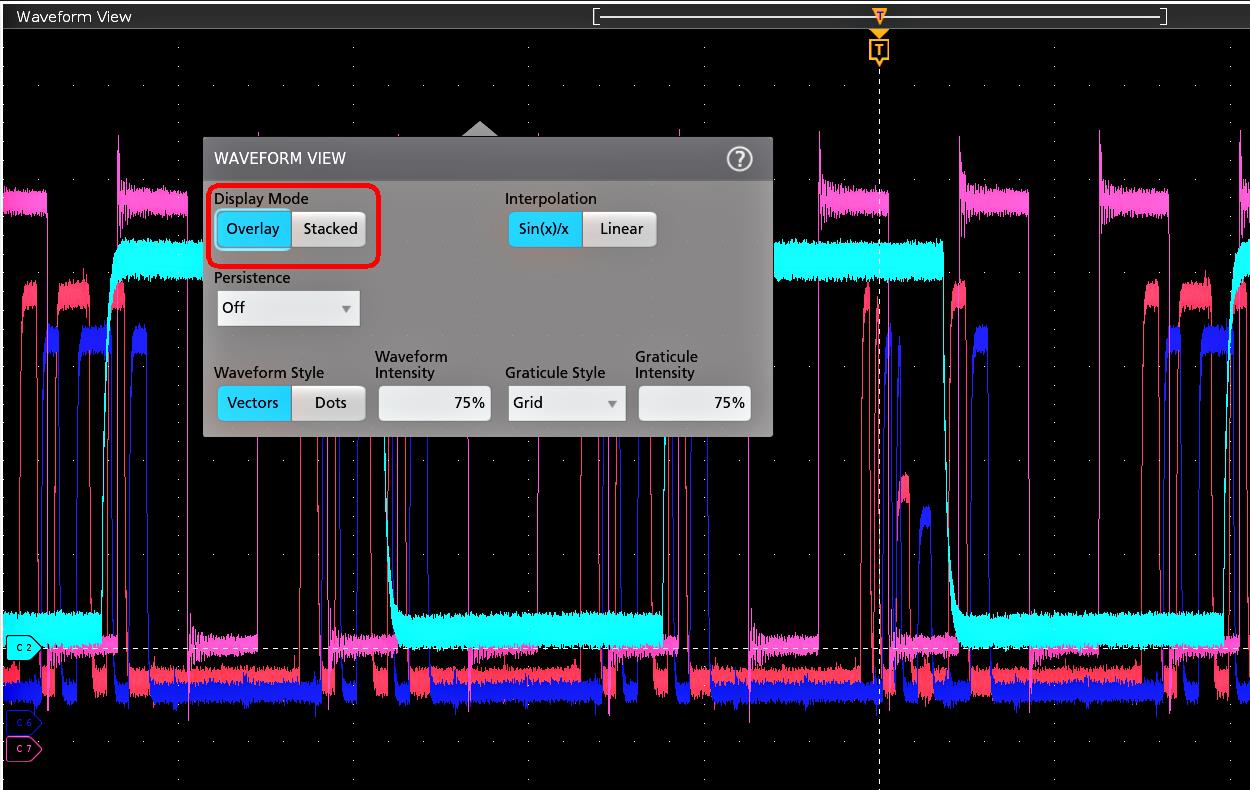
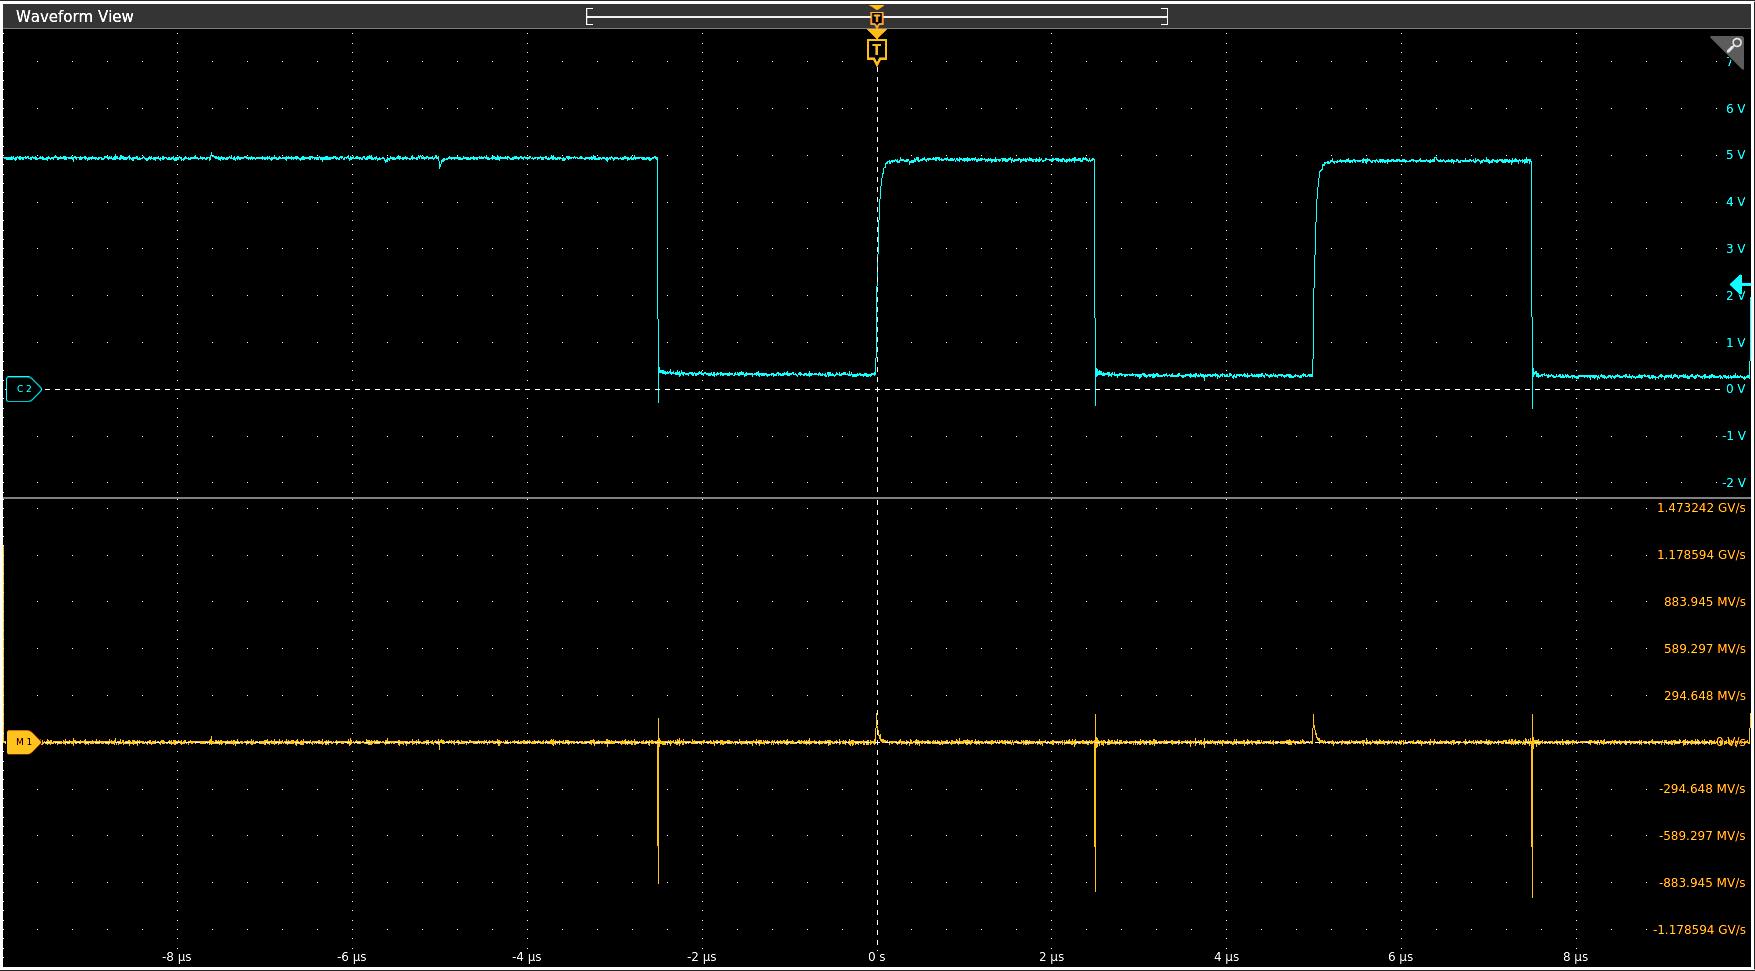
2The Waveform view area displays analog, digital, math, reference, bus, and trend waveforms. The waveforms include waveform handles (identifiers), individual vertical graticule scale labels, and trigger position and level indicators. You can set the Waveform View to stack each waveform vertically in separate graticule, called slices (the default mode), or overlay all the waveforms on the screen (traditional waveform view). You can also add Measurement Results views (plots) for individual measurements. These plot views are separate view windows that you can move on the screen by dragging their title bar to a new position.
3The results bar contains controls for displaying cursors, adding callouts, plots, and result tables to the screen. You also are able to add badges to the results bar. To remove a measurement, search or other badge from the results bar flick-it off screen. The controls are:
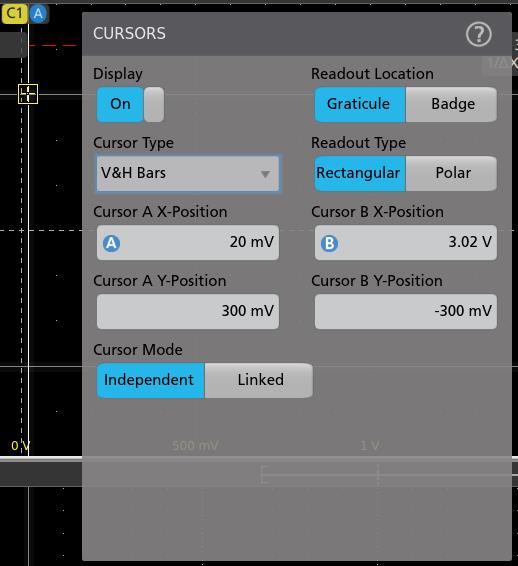
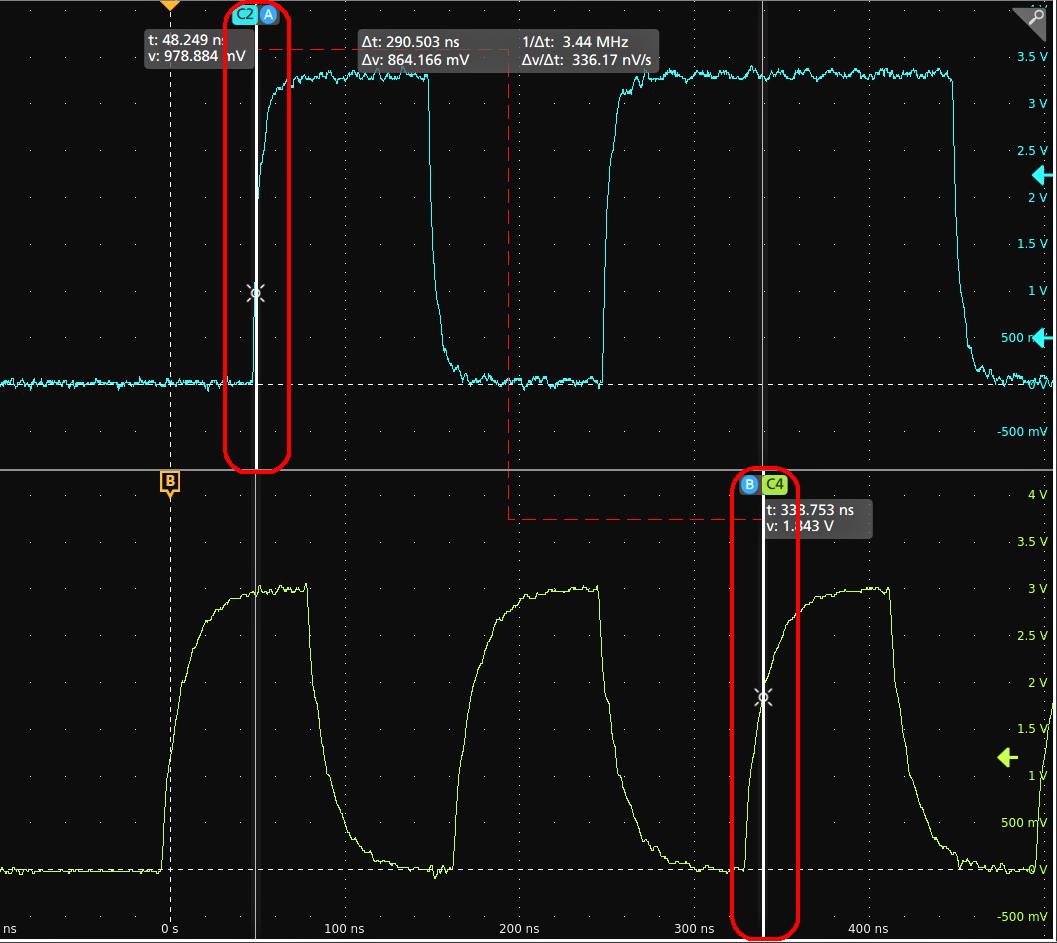
The Cursors button displays on-screen cursors in the selected view. Touch and drag, or use the multipurpose knobs, to move the cursors. Double-tap on a cursor, or on the cursor readouts, to open a configuration menu to set cursor types and related functions.
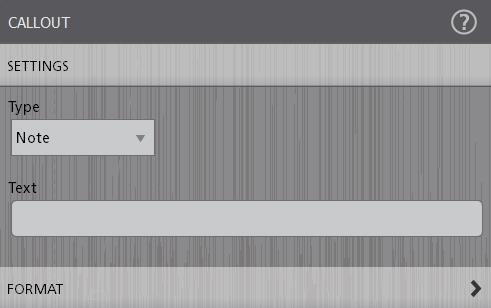
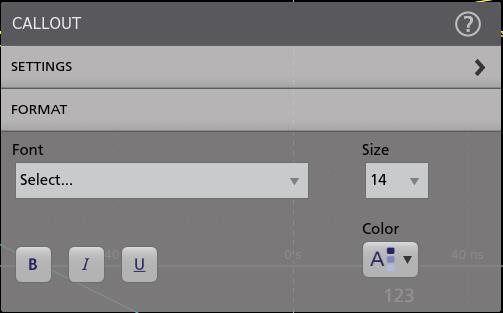
The Callout button adds a callout object to the selected view. Double-tap the callout text to open a configuration menu to change the type of callout, text and font characteristics. Drag any callout other than bookmark to any location on the oscilloscope screen view. Bookmarks callout can only be added to wave views and spectrum views.
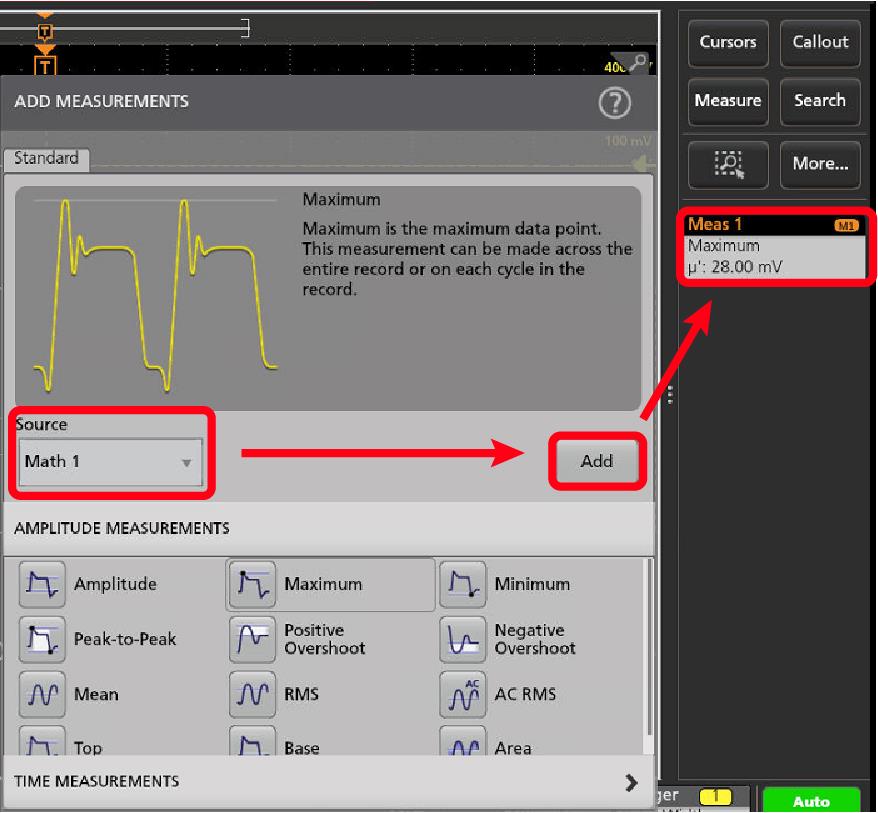
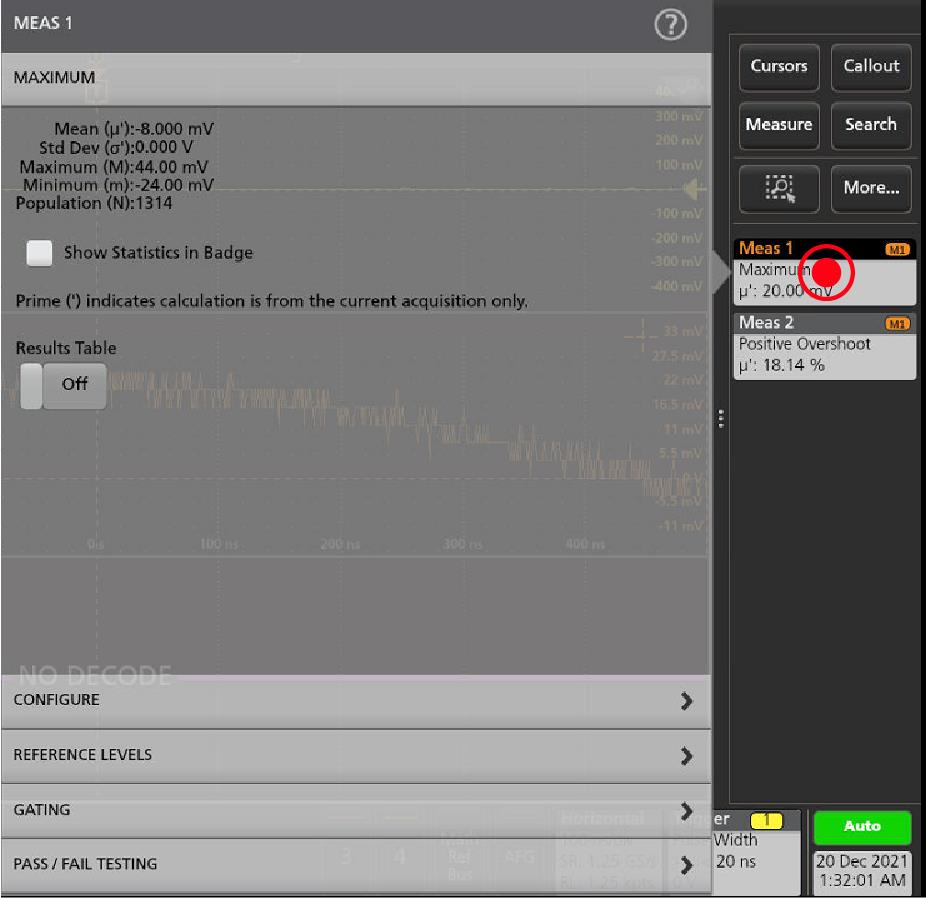
The Measure button opens a configuration menu from which to select and add measurements to the results bar. Each measurement you add has a separate badge. Double-tap a measurement badge to open its configuration menu.
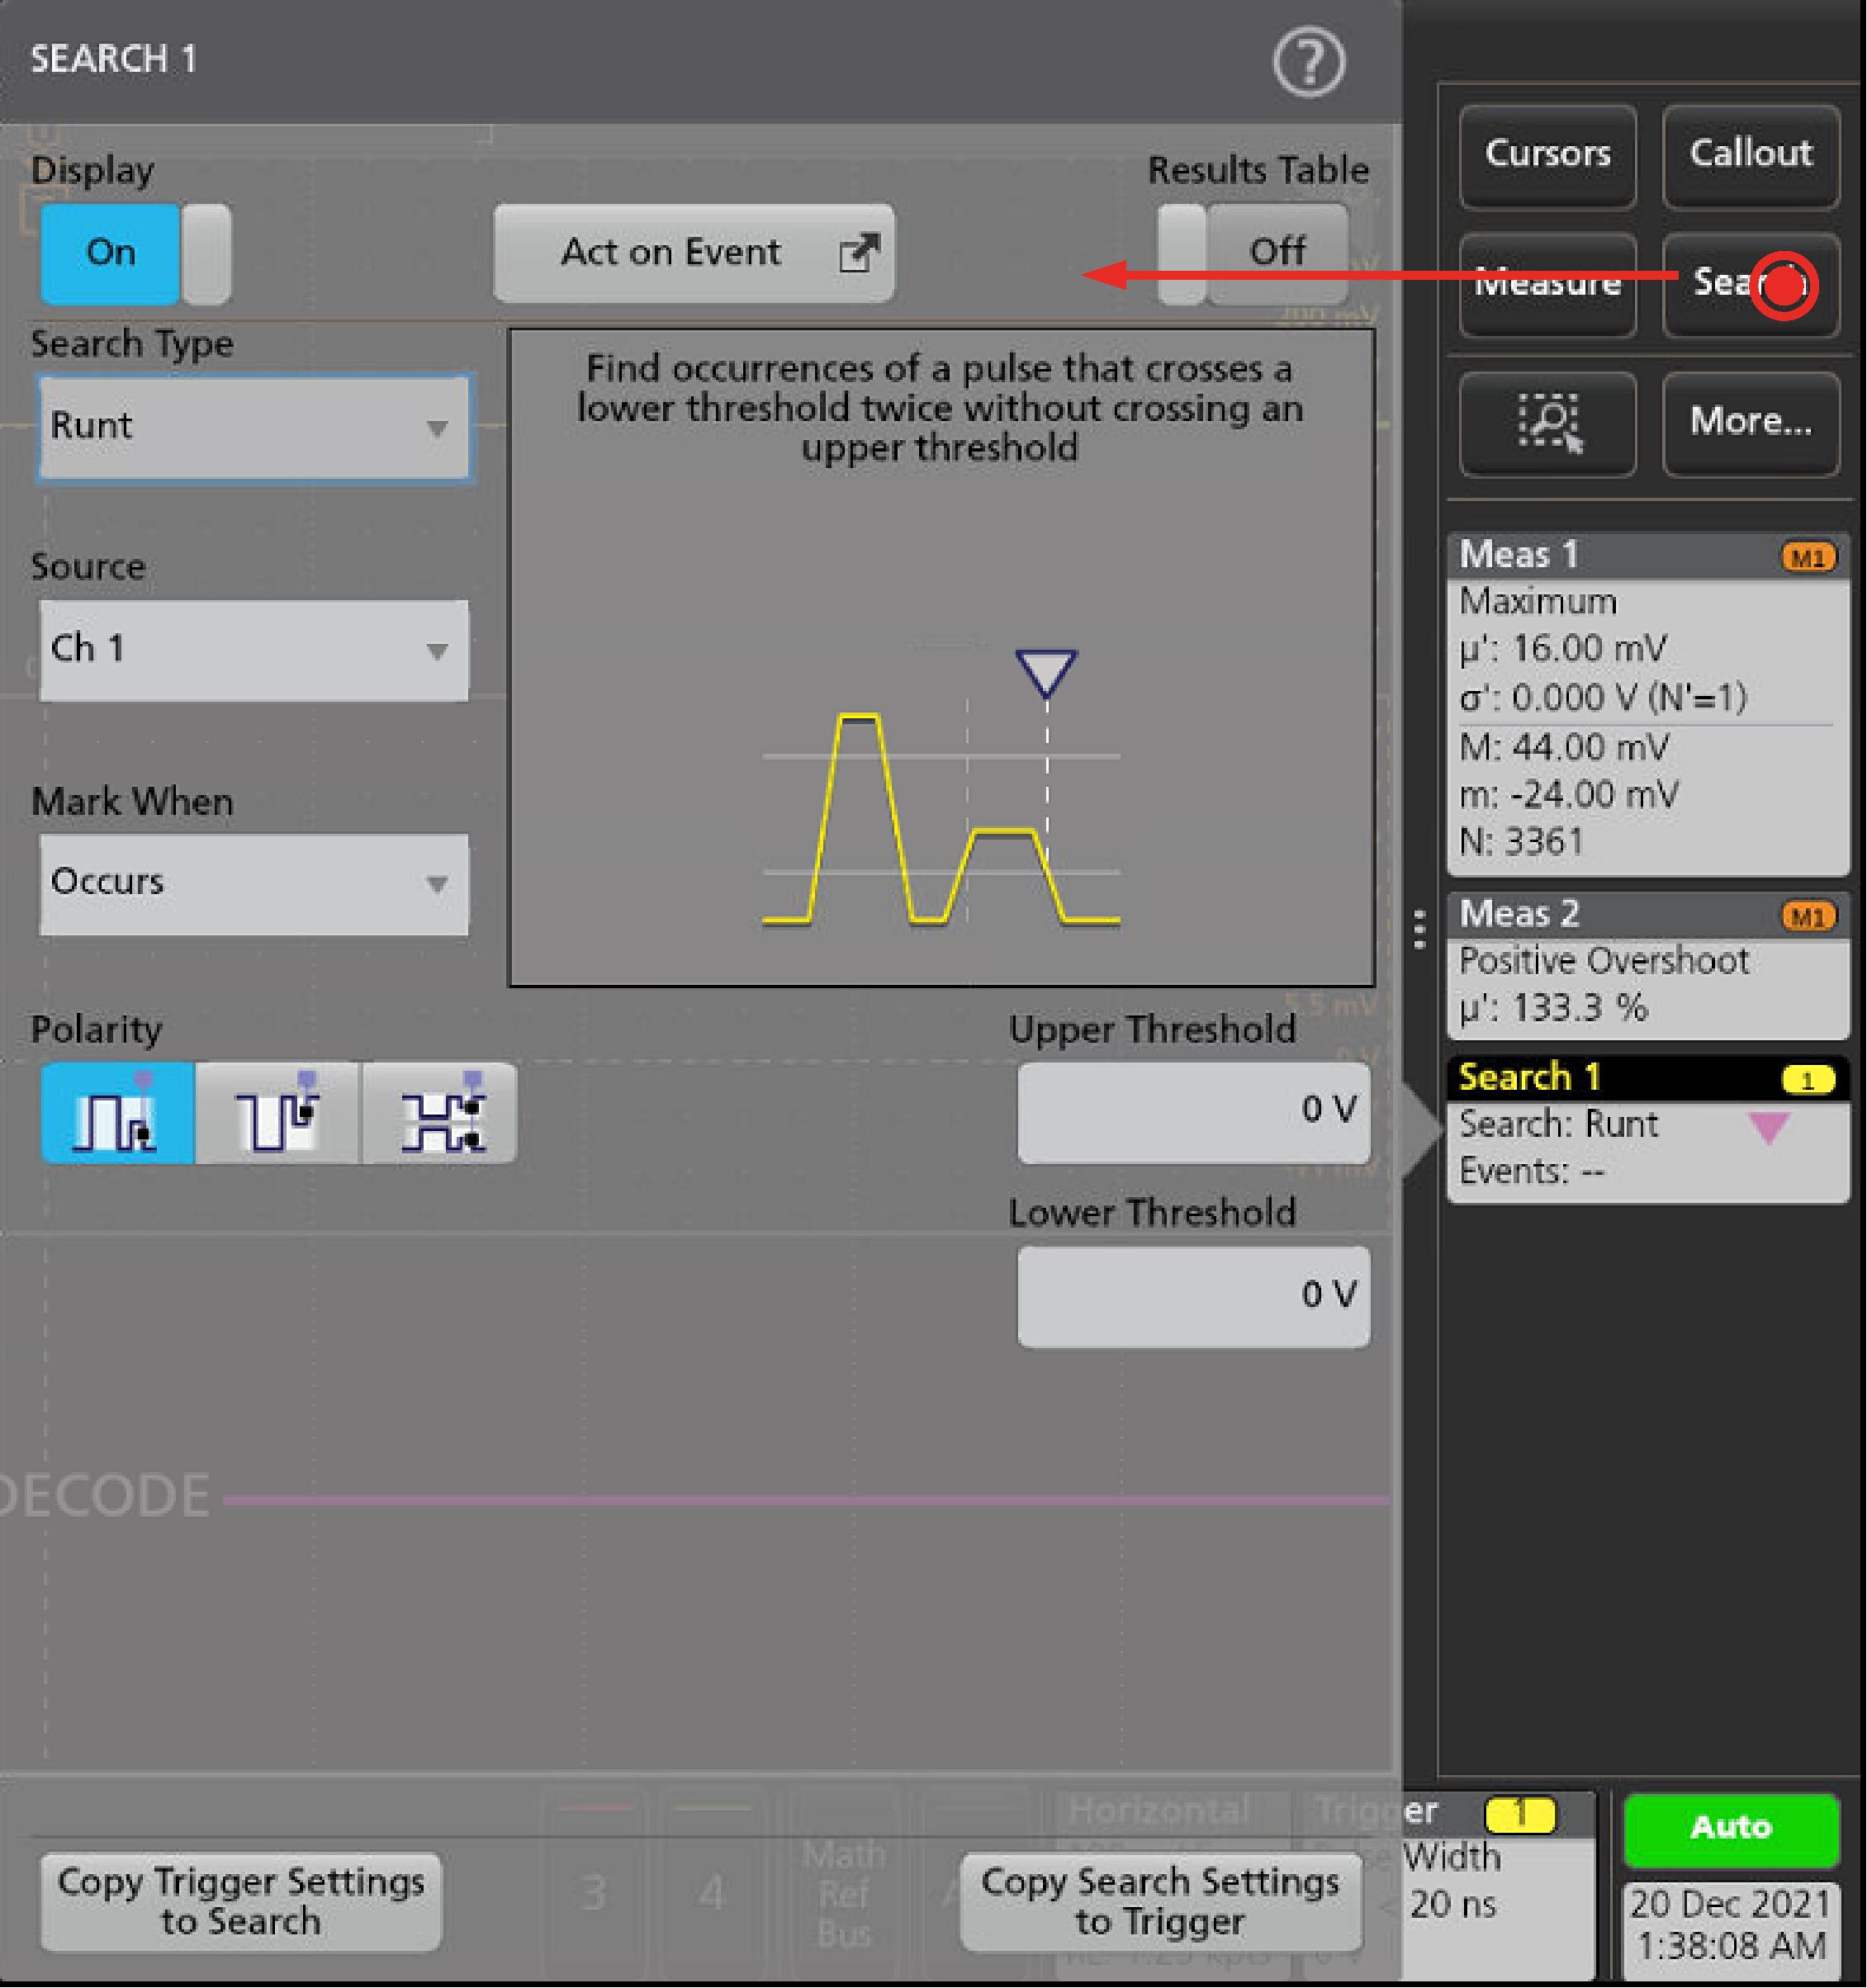
The Search button lets you detect and mark a waveform where specified events occur. Tap Search to open a configuration menu and set the search conditions for analog and digital channels. You can add any number of searches to the same waveform or to different waveforms. Search badges are added to the results bar.
The zoom icon button at lets you to draw a box on the screen to zoom in on an area of interest, drawing segments for mask testing, or drawing areas to define visual trigger conditions.
The More... button allows you to select Zoom and Mask.
4The settings bar contains the following elements. Tap a channel or waveform button to add it to the screen and display a badge. Double-tap a badge to open its configuration menu.
System badges for setting Horizontal, Trigger, and Date/Time parameters
Inactive Channel buttons to turn on channels
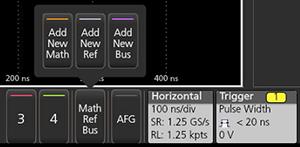
Add New Waveform buttons to add math, reference, and bus waveforms to the display
Channel and Waveform badges that let you configure the individual waveform parameters
5Configuration menus let you quickly change the parameters of the selected user interface item. You can open configuration menus by double-tapping on badges, screen objects, or screen areas.

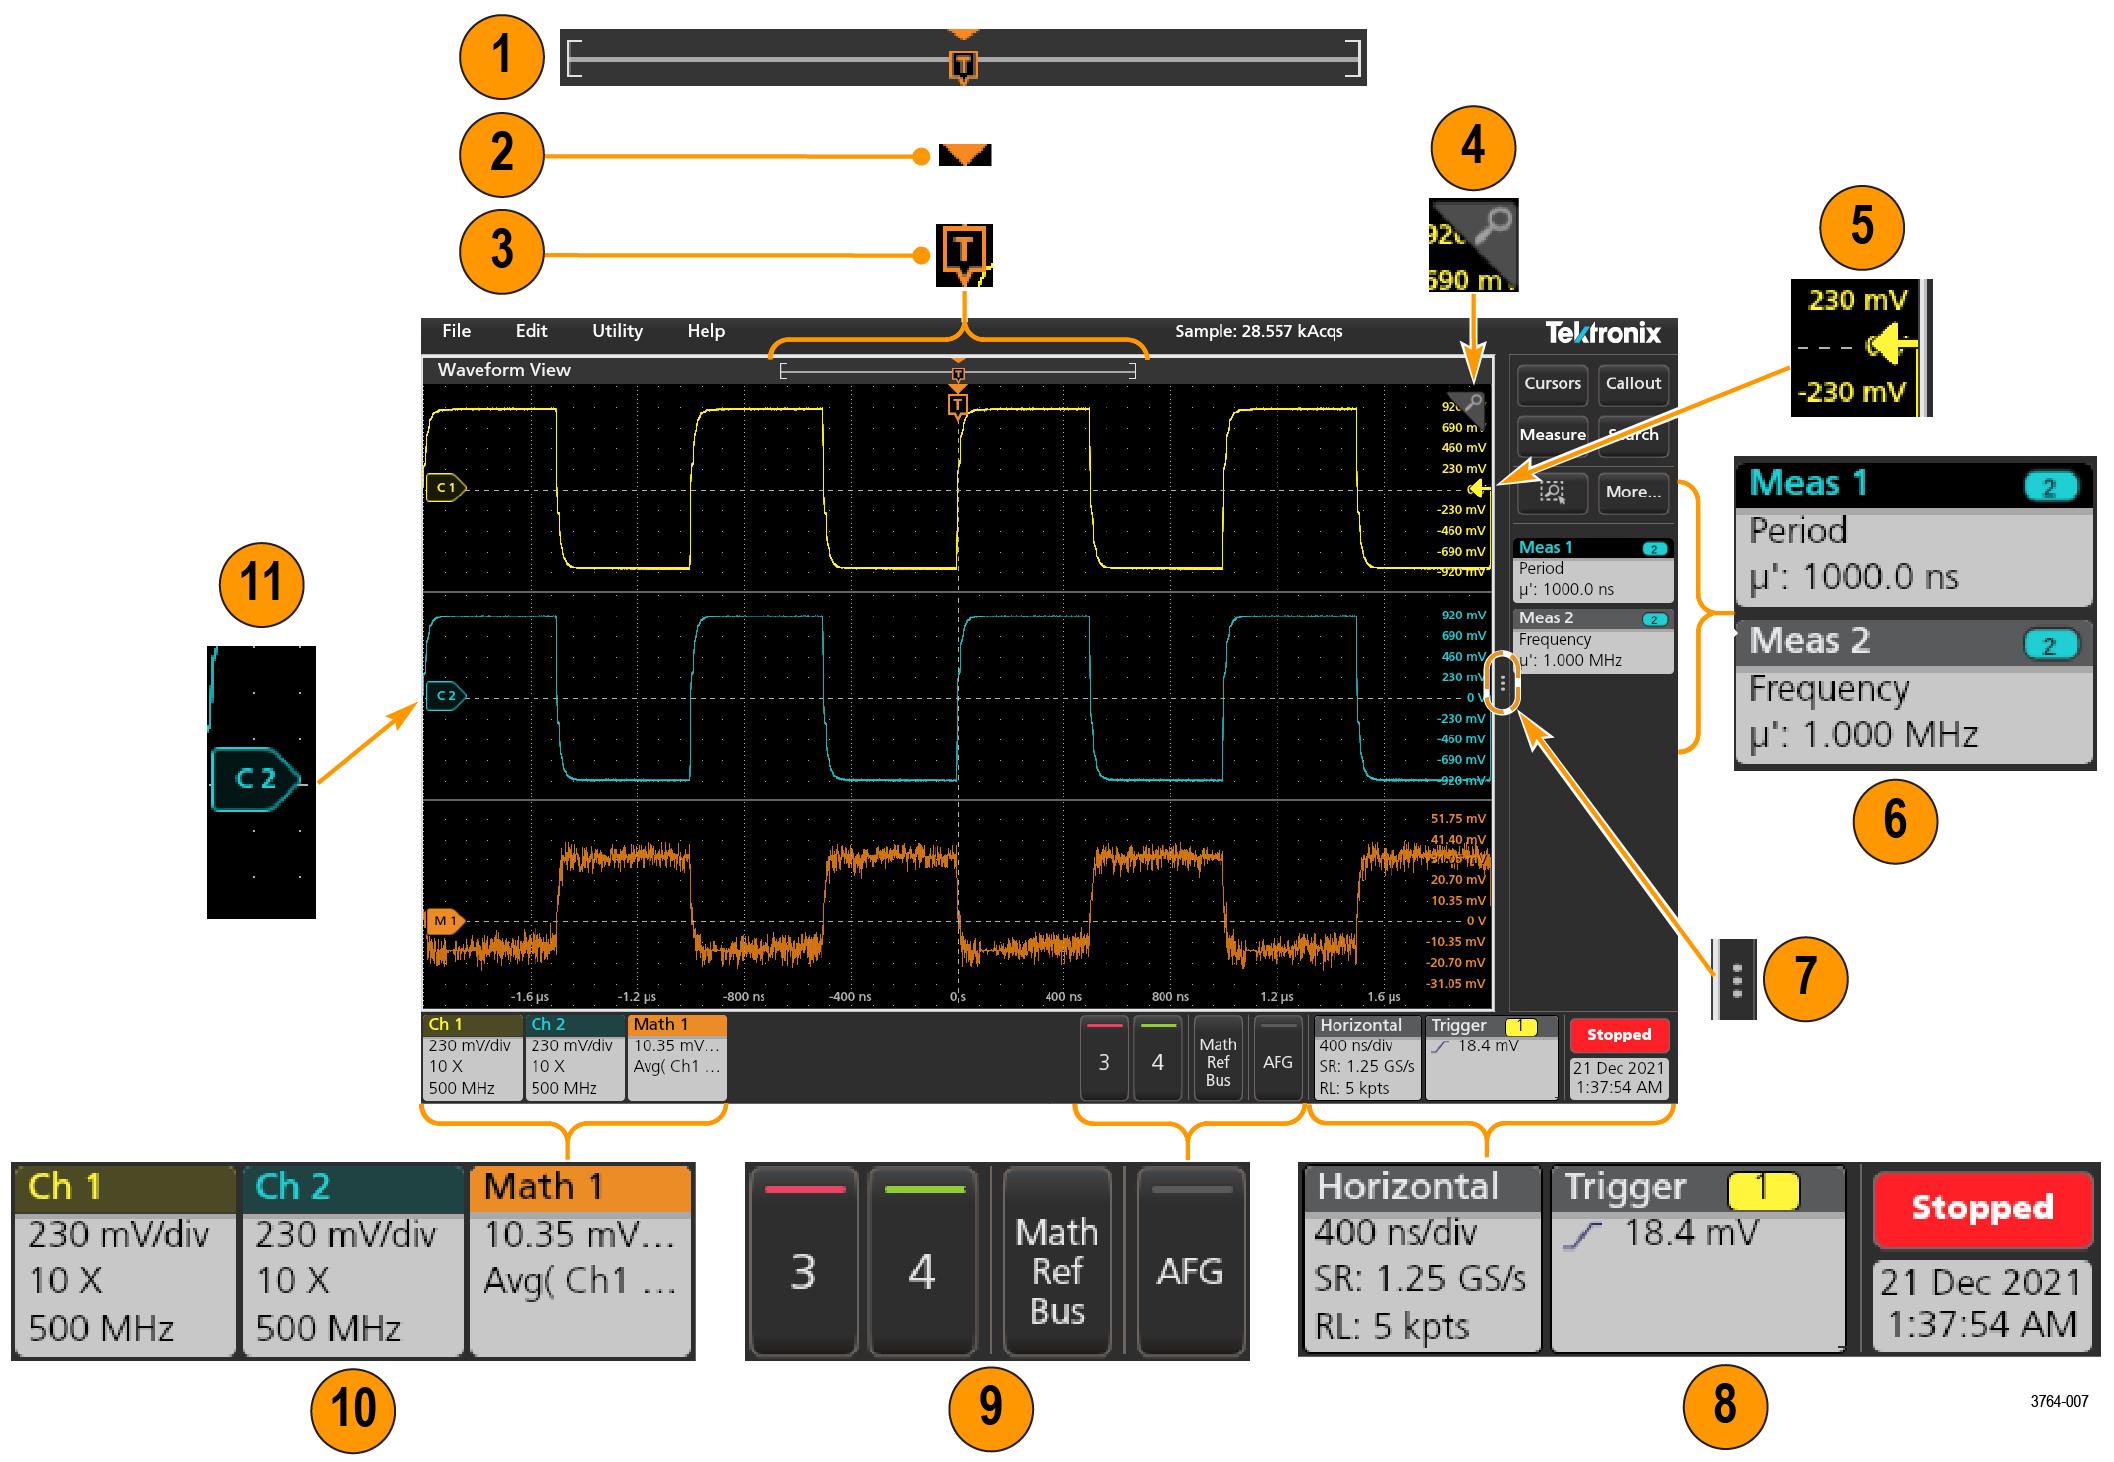
User interface elements

Each area of the user interface has a specific function that helps manage information or controls.

  1. The Waveform Record View is a graphical high-level view of the overall waveform record length, how much of the record is on the screen (shown in brackets), the location of key time events including the trigger event, and the current position of waveforms cursors.
    If you are displaying a Reference waveform that is shorter than the current acquisition record length, or you are changing the horizontal time scale while the oscilloscope acquisition is stopped, the brackets change position to show the part of the waveform record that is being viewed relative to the current acquisition total record length.

    If cursors are active on a waveform, the Waveform Record View shows the relative cursor positions as small vertical dashed lines.

    When in Zoom mode, the Waveform Record View is replaced with the Zoom Overview.

  2. The Expansion Point icon on the waveform view shows the center point around which the waveform expands and compresses when changing horizontal settings.
  3. The Trigger Position Indicator shows where the trigger event occurred in the waveform record. The trigger icon is displayed in the waveform slice that is the trigger source.
  4. The Zoom icon switches zoom on and off. The front panel Multipurpose knobs also turn on zoom mode and change the position and horizontal size of the Zoom Box.
  5. The Trigger Level Indicator icon shows the trigger level on the trigger source waveform. Some trigger types require two trigger levels.
  6. Measurement and Search badges show measurement and search results.
  7. The Results Bar Handle opens or closes the results bar, to maximize waveform screen viewing when needed. To reopen the results bar, either tap the handle icon or swipe left from the right side of the display.
  8. The System badges show global instrument settings (Horizontal, Trigger, Run/Stop status, and Date/Time).
  9. The Inactive Channel buttons add channel waveforms to the Waveform view and add an associated Channel badge to the Settings bar.

    The optional AFG button opens the AFG configuration menu to set and enable the AFG output. This button is only present if the AFG option is installed.

    The optional PG button opens the PG configuration menu to set and enable the PG output. This button is only present if the DPG option is installed.

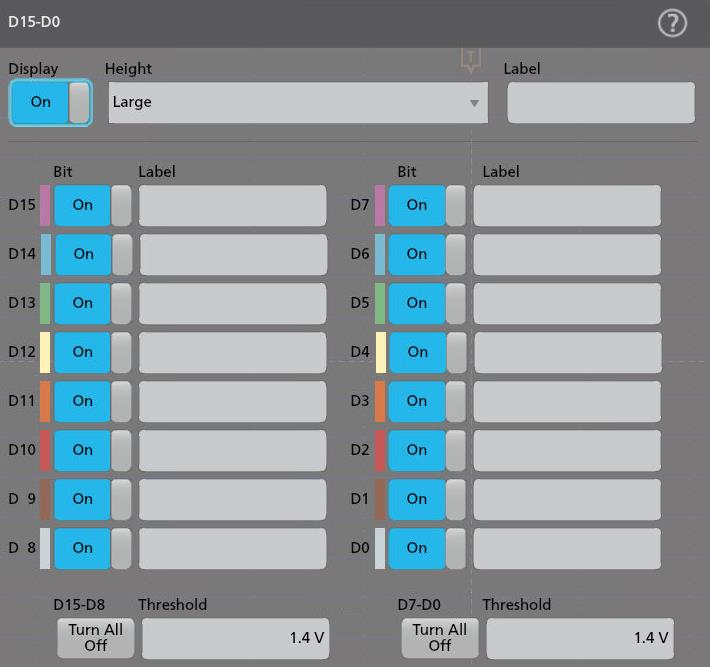
    The optional D15-D0 button opens the digital channel configuration menu to set and enable the digital channel. This button is only present if the 2-MSO option is installed.

  10. Double-tap a badge to open its associated configuration menu. If you add more Channel or Waveform badges than can fit in the waveform badge display area, tap the scroll buttons at each end of the waveform badge area to scroll and display hidden badges.
  11. The Waveform Handles on each waveform identify the source of that waveform (Cx for channels, Mx for Math waveforms, Rx for Reference waveforms, Bx for bus waveforms). The waveform handles are at the zero-volt level of the waveform by default. The currently selected waveform handle is a solid color; unselected waveform handles are outlined.

    Double-tapping a waveform handle opens the configuration menu for that waveform.

    For digital channels, the waveform handle shows the channel number. Each individual digital signal is labelled D0–D15 and is with a different color.

    Double-tapping a digital waveform handle opens the digital channel configuration menu.

    Dragging a digital signal handle over another handle swaps those two signals on the waveform.

Badges

Badges are rectangular icons that show waveform, measurement, and instrument settings or readouts. Badges also provide fast access to configuration menus. The badge types are Channel, Waveform, Measurement, Search, and System.

Channel and Waveform badges

Channel and Waveform (Math, Ref, Bus) badges are shown in the settings bar, located along the bottom left of the screen. Each waveform has its own badge. The badges show high-level settings for each displayed channel or waveform. Double-tap a badge to open its configuration menu.

Most Channel and Waveform badges also have Scale buttons, shown by single-tapping the badge. Use the Scale buttons to increase or decrease the vertical scale setting for that waveform.

You can drag Channel and Waveform badges to change their position in the Settings bar and open the badge right-click menu to access a quick-action menu.

There are two ways to delete Channel and Waveform badges.
  • Right-click the badge and turn it off.
  • Flick the badge off the bottom edge of the display to remove it from the Settings bar. Flicking upwards from the bottom edge of the Settings bar recovers the badge. Badge recovery is only possible within 10 seconds of removal.

Channel badges are listed in the channel order unless you have moved them. Channel badges may also display short error or warning messages. For more information double-tap the badge to open its configuration menu, or search the instrument Help.

Waveform badges (Math, Ref, Bus) are listed in the order created (unless they have been moved), and are grouped together by type. Deleting a Waveform badge does not change the order or names of the remaining badges.

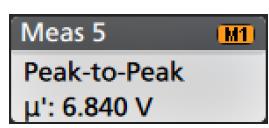
Measurement badges

Measurement badges are located in the Results bar. They show measurements or search results. The badge title also shows the measurement source or sources. To add a Measurement badge, tap the Measure button and select a measurement.

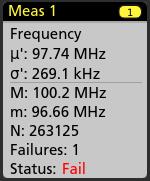
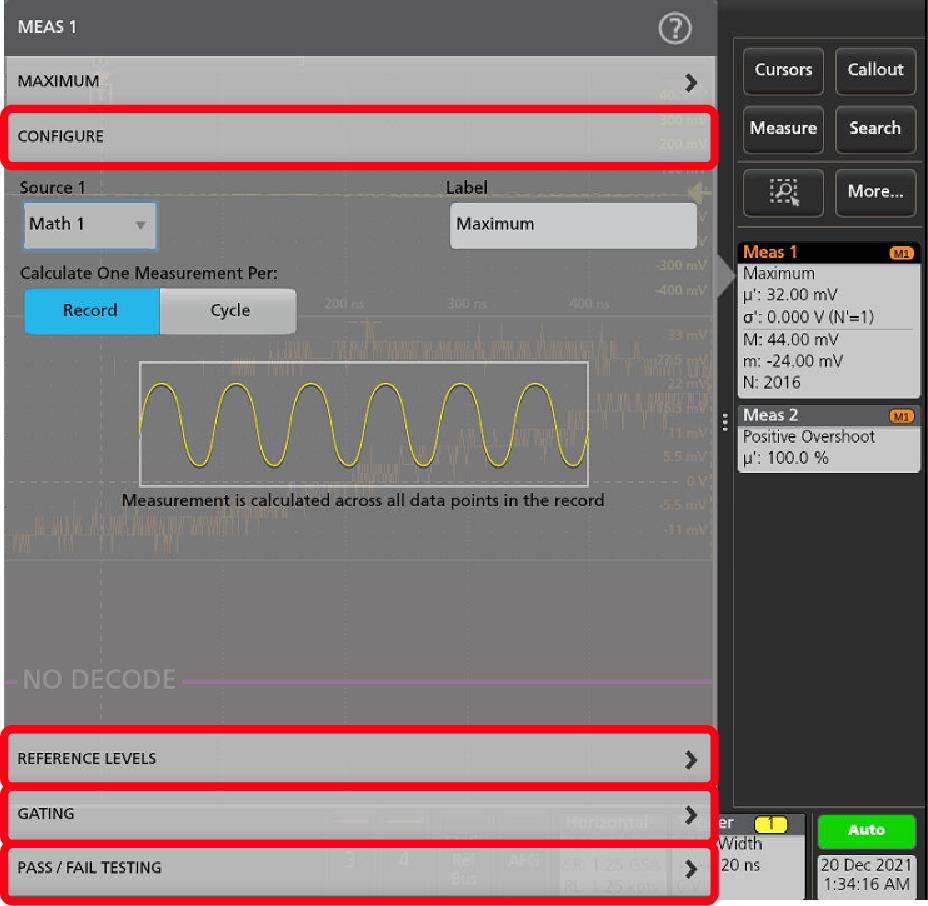
Double-tap a Measurement badge to open its configuration menu to change or refine settings. The default measurement badge readout shows the measurement's mean (μ) value.

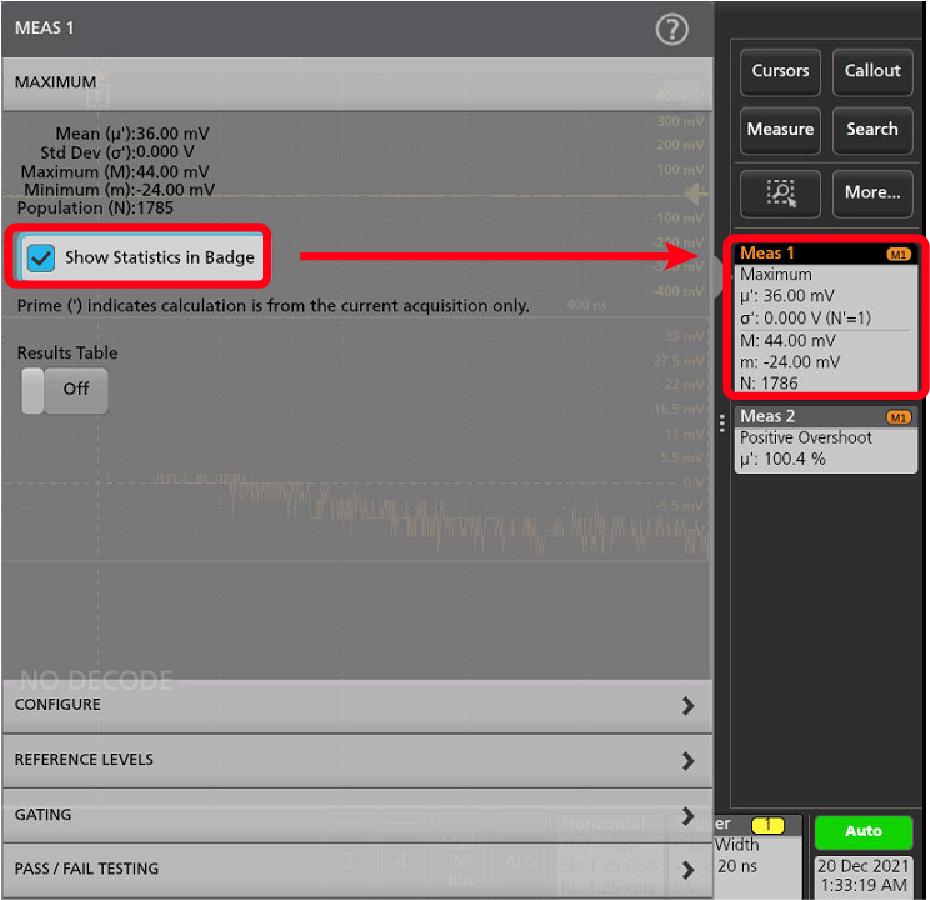
To add statistical readouts to individual measurement badges, double-tap a measurement badge to open its configuration menu and select Show Statistics in Badge. The measurement badge displays the standard deviation (σ) value. The standard deviation is zero, when the population is one.

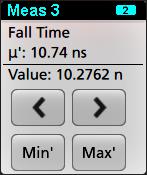
Some Measurement badges also have Navigation buttons, shown by single-tapping the badge.

The < (Previous) and > (Next) buttons center the waveform in the display at the position of the previous or next measurement point in the record (for measurements that take more than one measurement per acquisition).

The Min' and Max' navigation buttons center the waveform in the display at the minimum or maximum value for that measurement in the current acquisition.

The prime symbol (') shown on measurement readings and Min/Max buttons indicates that the value shown (or moved to in the case of Min/Max buttons and waveforms) is from the current acquisition. Lack of a prime symbol means the value is from all acquisitions.

The Measurement badge displays Status and Failures information when pass/fail testing is enabled through the configuration menu. The Status line shows Pass (green) or Fail (red) according to the conditions defined in the Pass/Fail Testing panel. The number of Failures are displayed when statistics are shown in the badge. The Pass/Fail status, number of Failures, and the Limit(s) set in the Pass/Fail Testing panel are available in the Measurement Results table.

Measurement badges are listed in the order created, starting at the top of the Results bar. Deleting a Measurement badge does not change the order or names of the remaining badges.

You can drag Measurement badges to change their position in the Results bar and open the badge right-click menu to access a quick-action menu.

There are two ways to delete Channel and Waveform badges.
  • Right-click the badge and turn it off.
  • Flick the badge off the right edge of the display to remove it from the Results bar. Flicking left from the right edge of the Results bar recovers the badge. Badge recovery is only possible within 10 seconds of removal.

Pattern Generator badge

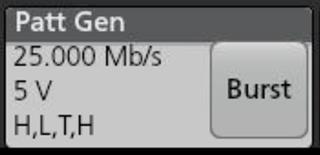
The pattern generator badge display in the Settings bar when pattern generator is set to Continuous or Burst mode.

The pattern generator badge lists the bit rate, amplitude, and pattern definition. If the Pattern Definition is set to Manual, the badge shows the Bits 3 to 0. If Pattern Definition is set to File, the badge shows the file name. The Burst button displays in the badge when pattern generator Output is set to Burst.

To delete the pattern generator badge, right-click the badge and select Output > Off.

Mask Test badge

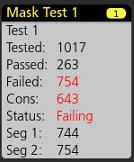
The mask test results and measurement statistics are displayed in the Mask Test badge in the Results bar. The badge is created when the first segment of a mask is defined.

Badge readoutDescription
Label (optional readout)A label defined in the badge configuration menu.
TestedThe total number of waveforms tested against the mask.
PassedThe number of waveforms that contained no samples that violated the mask.
FailedThe number of waveforms that contained one or more samples that violated the mask. Displays in red if greater than or equal to the total failures threshold.
ConsThe highest number of consecutively failed waveforms in the test run. Displays in red if greater than or equal to the consecutive failures threshold.
StatusThe status of the mask test. It can be On, Off, Passed/Passing (green) or Failed/Failing (red).
Seg n (optional readout)The number of waveforms that contained one or more samples that violated mask segment n.

Double-tap a Mask Test badge to open its configuration menu to change or refine settings.

You can drag the badge to change its position in the Results bar and open the badge right-click menu to access a quick-action menu.

There are two ways to delete Channel and Waveform badges.
  • Right-click the badge and turn it off.
  • Flick the badge off the right edge of the display to remove it from the Results bar. Flicking left from the right edge of the Results bar recovers the badge. Badge recovery is only possible within 10 seconds of removal.

Cursor Badges

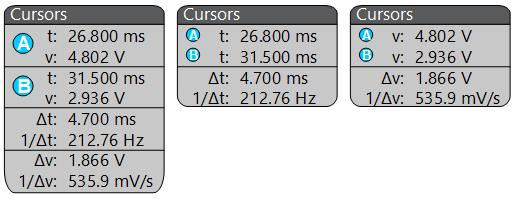
You can display the cursor readouts in a Cursors badge in the Results bar. The badge contents depend on the cursor in use.

To create a cursor readouts badge, turn on Cursors, double-tap a cursor readout to open its configuration menu, and set the Readouts mode to Badge.

Note:You can only view cursor readouts in one location at a time; either on the waveform or in a Cursors badge. You cannot move cursor readouts to a badge for Spectrum View cursors.

You can drag the badge to change its position in the Results bar and open the badge right-click menu to access a quick-action menu.

There are two ways to delete Channel and Waveform badges.
  • Right-click the badge and turn it off.
  • Flick the badge off the right edge of the display to remove it from the Results bar. Flicking left from the right edge of the Results bar recovers the badge. Badge recovery is only possible within 10 seconds of removal.

Search badges

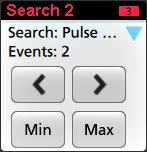
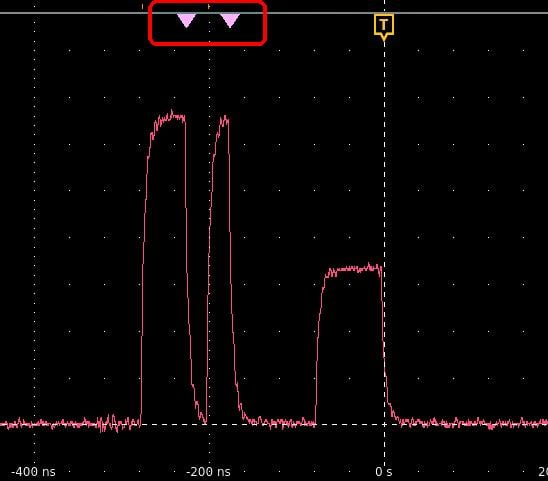
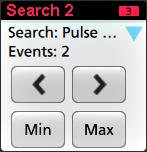
Search badges are also shown in the Results bar, below the Measurement badges. A search badge lists the search source, search type, and the number of search event occurrences in the current acquisition. The instrument marks the waveform where those events occur with small down-pointing triangles along the top of the waveform graticule. Double-tap a search badge to open its configuration menu to change or refine search settings.

Search badges are created by tapping the Search button. Use the displayed configuration menu to set the search criteria.

Search badges have < (Previous) and > (Next) Navigation buttons that open the Zoom mode and center the waveform in the display at the position of the previous or next search mark in the waveform record. Search badge Navigation buttons are only usable when the oscilloscope is in single acquisition mode. Single-tap a badge to close the Navigation buttons.

Some searches also provide Min and Max navigation buttons that open the Zoom mode and center the waveform in the display at the minimum or maximum value for that search event in the current acquisition.

Search badges are listed in the order created. Deleting a Search badge does not change the order or names of the remaining badges.

You can drag Search badges to change their position in the Results bar and open the badge right-click menu to access a quick-action menu.

There are two ways to delete Channel and Waveform badges.
  • Right-click the badge and turn it off.
  • Flick the badge off the right edge of the display to remove it from the Results bar. Flicking left from the right edge of the Results bar recovers the badge. Badge recovery is only possible within 10 seconds of removal.

Deleting mass Measurements/Searches badges at once

This badge helps you to delete/remove many number measurements or searches, which are in the Results bar.
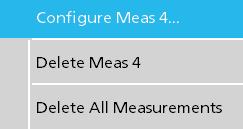
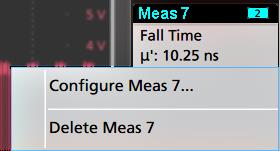
  1. Select and right click on the Measurement/Search badge in the Results bar, which displays the dialog box as shown:

    ControlsDescription
    Configure Measurement/SearchConfigure Measurement or Search badges
    Delete Measurement/SearchDeletes the selected Measurement (standard, power, etc.)/Search badge in the Results bar.
    Delete All Measurement/SearchDeletes all the Measurement (standard, power, etc.)/Search badges in the Results bar.
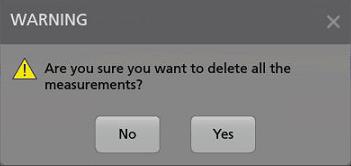
  2. When Delete All Measurements is selected, the oscilloscope asks for the confirmation to delete all the measurements/search at a time.

  3. The dialog box provides you a checkbox that gives the choice to bypass remaining information dialogs.
    • Don’t ask for remaining items: Default is unchecked. If you leave it unchecked and clear the information dialog, then the dialog will appear again for the next measurement deletion.
    • If the box is checked, it proceeds with deleting the rest of the items without bringing up the dialog box again. The dialog box appears for each set of measurements you want to delete.

Signal Clipping and Badges

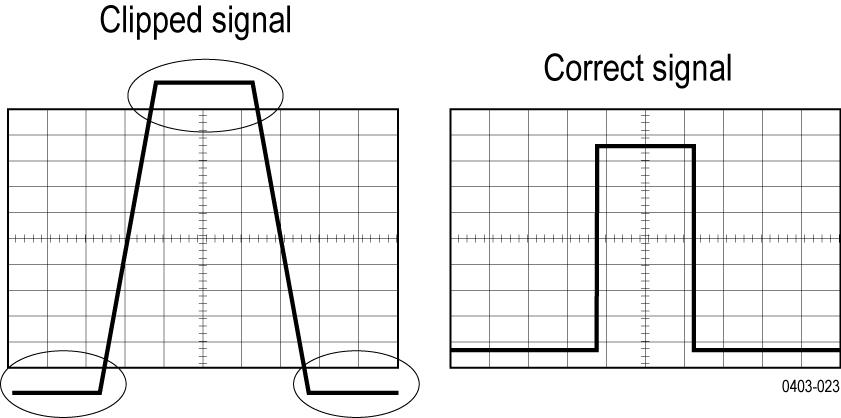
WARNING:Clipping is caused by excessive or dangerous voltage at the probe tip, and/or a vertical scale setting that is not adequate to display the entire vertical range of the waveform. Excessive voltage at the probe tip can injure the operator and cause damage to the probe and/or instrument.
This instrument shows a warning triangle symbol and the words Clipping in a Channel badge when a vertical clipping condition exists. Any measurement badges associated with that channel also indicate a clipping condition by turning the measurement text red and listing the type of clipping (positive or negative).

To close the clipping message, change the vertical scale to show the entire waveform, disconnect the probe tip from the excessive voltage source, and check that you are probing the correct signal using the correct probe.

Clipping causes inaccurate amplitude-related measurement results. Clipping also causes inaccurate amplitude values in saved waveform files. If a math waveform is clipped, it will not affect amplitude measurements on that math waveform.

System badges

System badges (in the settings bar) display the main Horizontal and Trigger settings. You cannot delete System badges.


Double-tap a System badge to open its configuration menu.

The Horizontal badge also has Scale buttons, shown by single-tapping the badge. Use the Horizontal Scale buttons to increase or decrease the horizontal time setting.

Common badge actions

Action Result Example
Single tap Immediate access controls (Scale, Navigation).
Double tap Configuration menu with access to all settings for the badge.

Touch and hold Right-click menu with single tap access to common actions. Typical actions include turning off a channel and deleting a measurement or search badge.
Flick Flick the badge off the bottom edge of the display to remove it from the Settings bar.

Flick the badge off the right edge of the display to remove it from the Results bar.

Flick from the right or bottom edge to recover a removed badge. This action is only possible within 10 seconds of badge removal.

Badge selection status

The appearance of a badge indicates its selection status (selected or unselected), or if a measurement needs to be deleted to close a channel or waveform badge.
Badge type Selected Unselected Turned off or in use
Channel or Waveform
Measurement N/A

A dimmed Channel badge means the screen waveform is turned off (but not deleted). A dimmed Waveform badge means that the waveform display is turned off, or it is being used as a source by a measurement and cannot be deleted until the measurement is deleted.

Moving waveform and measurement badges

You can move waveform and measurement badges within their display bars to meet your measurement needs. Simply touch and drag the badge to a new position.

Moving waveform badges in the Settings Bar

  • A waveform badge can only be moved within the Settings Bar.
  • Dragging a waveform badge to a new location selects that waveform.
  • Dragging a badge to a new location causes the non-selected badges to move slightly to create the position at which to insert the badge.
  • To move a badge to a position that is off screen of the displayed bar badges (scroll buttons are present), drag the badge that you're moving onto one of the scroll buttons. The badges that are off screen shift onscreen one at a time until you move the badge off of the scroll button and position it in the displayed badges.
  • Changing the order of waveform badges or badge groups also changes the order of displayed waveforms in the Waveform view. The order of badges or badge groups (left to right) in the Settings bar determines the order of slices in the display (top to bottom).
  • Once you have moved any waveform badge (Channel, Math, Ref, Bus) on the Settings bar to a new position, adding a new badge adds that badge to the right of the existing badges. This differs from the default badge addition action, which listed badges together by category (Channels, Math, Ref, Bus) and arranged the badges in numerical order within each badge category. To restore the default badge addition method, tap File > Default Setup and add the waveform badges back onto the Settings bar.
  • Changing the order of bus waveform badges changes the order of the tabs in a bus decode Results table.

Moving badges in the measurement Results Bar

  • A Measurement or Search badge can only be moved within the Results Bar.
  • Dragging a badge to a new location causes the non-selected badges to move to create the position at which to insert the badge.
  • Once you have moved any Results badge to a new position, adding a new Measurement or Search badge adds that badge to the bottom of the Results bar badges.
  • To move a badge to a position that is off screen of the displayed bar badges (scroll buttons are present), drag the badge that you're moving onto one of the scroll buttons. The badges that are off screen shift onscreen one at a time until you move the badge off of the scroll button and position it in the displayed badges.
  • Changing the order of Measurement badges in the Results bar changes the order of measurements shown in a Results table.
  • Changing the order of Search badges in the Results Bar changes the order of the tabs shown in a Search Results table.

Badge grouping

You can group signal badges in the Settings bar to display multiple waveforms in a single slice.

Group signal badges in the Settings bar

You can group signal badges in any combination of channel, waveform, math, reference and bus badges to display related waveforms in the same display slice. Use this feature to group related signals for easier visual comparisons.

To group one or more signal badges, drag a badge onto another badge until the background badge turns red, then release. Repeat to add other badges to a group. Each group is shown in its own slice as a set of overlaid waveforms.

Badge group characteristics

  • Badges in a group are listed left to right in the order they were added to the group.
  • The badge group color is the color of the last selected badge in the group.
  • Use standard touch and menu interactions to select and change individual badge settings.
  • You can drag and move badge groups the same way as individual badges.
  • The order of badges or badge groups (left to right) determines the order of slices in the display (top to bottom).
  • To ungroup a single badge, drag it vertically and release. You can also ungroup a single badge by touching and holding a badge in the group to open its right-click menu, and select Ungroup Badge(x) to ungroup the selected badge.
  • To ungroup the entire group, touch and hold any badge in the group to open its right-click menu. Select to ungroup the selected badge or ungroup all of the badges.

Badge group caveats

  • You cannot drag badges within a group to change their order.
  • You cannot add one badge group to another.
  • You cannot drag a badge group onto an individual badge to group those badges.

Configuration menus

Configuration menus let you quickly set the parameters for channels, system settings (Horizontal, Trigger), measurements, cursor readouts, Waveform and Plot views, callout text, and so on.

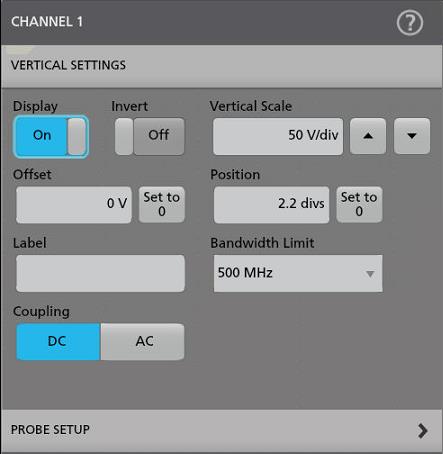
Double-tap an item (badge, Waveform View or Plot View, cursor readouts, callout text, and so on) to open its configuration menu. For example, double-tap a Channel badge in the Settings Bar to open its configuration menu.

Selections or values that you enter take effect immediately. Menu contents are dynamic, and can change depending on your selections, instrument options, or attached probes.

Related settings are grouped into 'panels'. Tap the panel name to show those settings. Changes to panel settings can change the values and/or fields shown in that panel and other panels.

Tap anywhere outside a configuration menu to close it.

To open Help content for a configuration menu, tap the question mark icon in the upper right corner of the menu.

Zoom user interface

Use the zoom tools to magnify waveforms to view signal details.


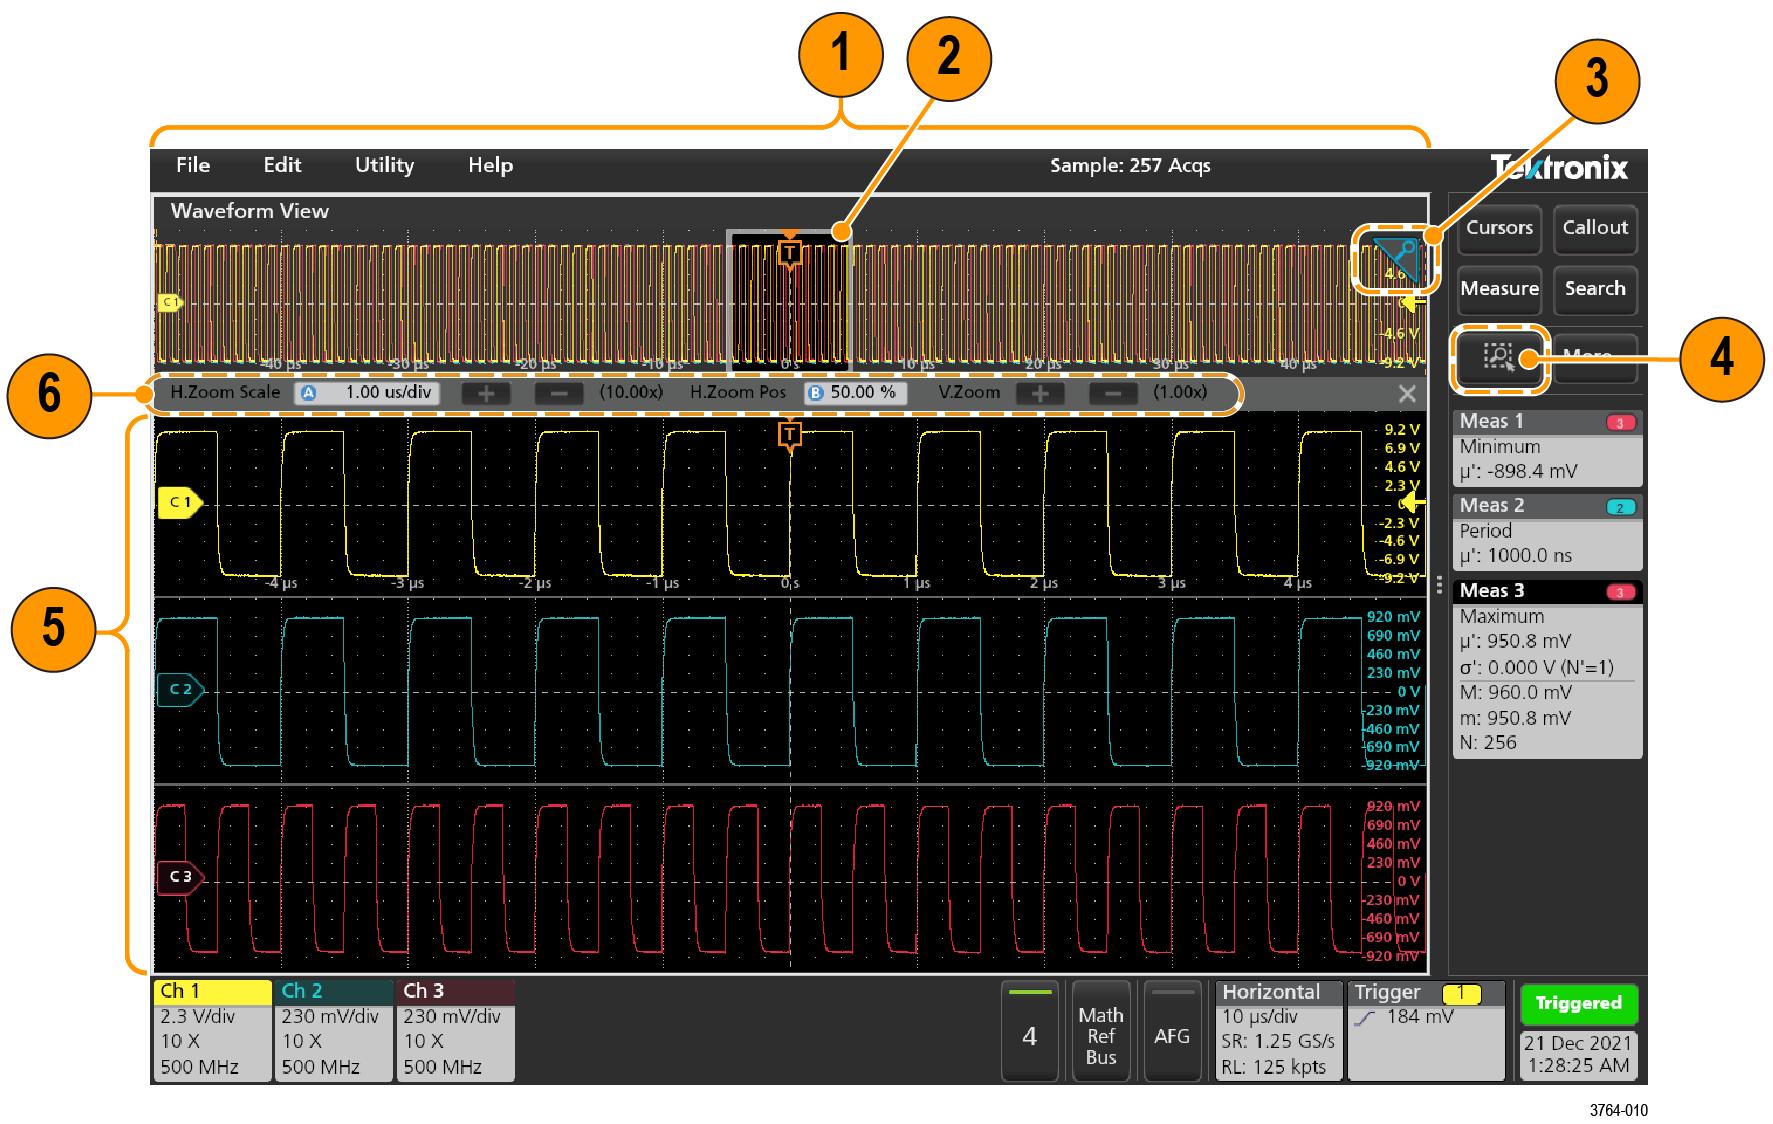
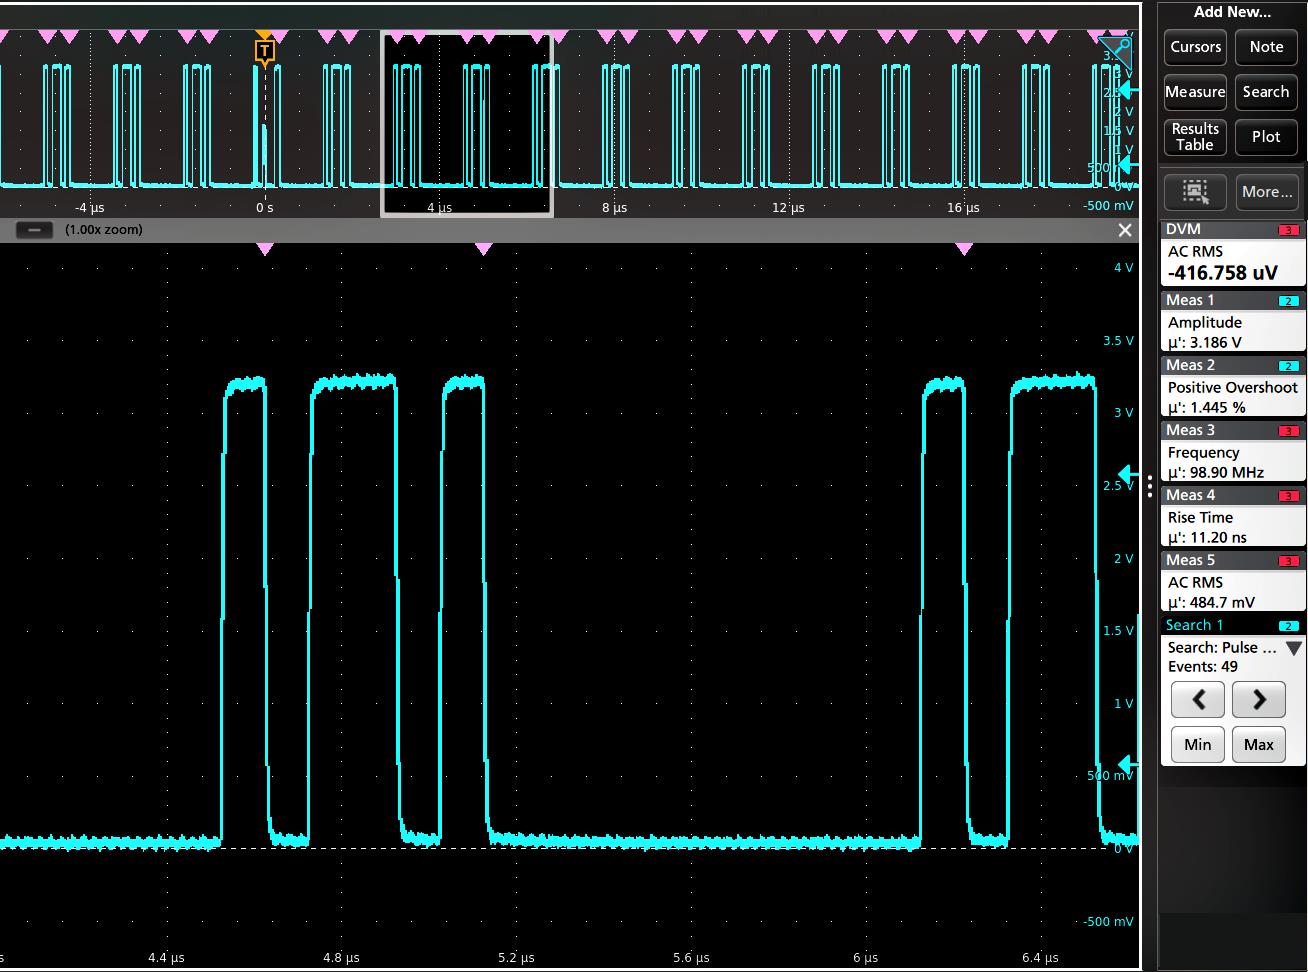
  1. The Zoom Overview shows the entire waveform record. All waveforms are shown in Overlay mode in the Zoom Overview area. Using pinch and expand gestures on the Zoom Overview waveforms changes the horizontal time base settings.
  2. The Zoom Box shows the area of the Zoom Overview to display in the Zoom View (see 5). You can touch and drag the box to move the area to view. Moving the Zoom Box, or changing its position, does not change the horizontal time base settings.
  3. The Zoom icon (in the upper right corner of the Waveform View) switches zoom mode on and off.
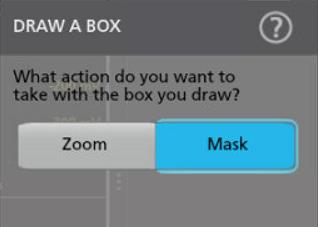
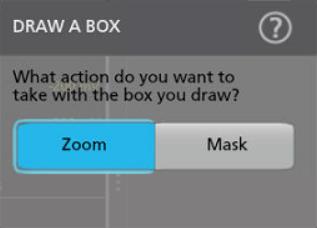
  4. A zoom box lets you quickly draw a box around an area of interest in the Waveform or Zoom Overview. Drawing a box immediately puts the oscilloscope into zoom mode. To draw a zoom box, tap the DRAW-A-BOX button (while in Zoom mode), then touch and drag on the waveform to draw a box waveform. You can continue to draw zoom boxes until you single tap anywhere on the screen or open a menu.

    To toggle between Zoom mode and Mask mode, double-tap the DRAW-A-BOX button and select one of the options. Search for the Mask Testing topics in the oscilloscope Help for more information.

  5. The Zoom View shows the zoomed waveforms, as marked by the Zoom Box, in the Zoom Waveform Record View. Use pinch and/or drag options in the zoom view to change the zoomed area of interest. Pinch, expand, and drag gestures in the Zoom View only change zoom magnification settings and Zoom Box position.
  6. Use the Zoom Title Bar controls to adjust the vertical and horizontal size of the zoom area. Click or tap the + or - buttons or use the A and B multipurpose knobs.

    In a waveform view, if both Cursor and Zoom are turned on, use the Zoom Box and Cursors button to change the multipurpose knob functionality. Tap the Zoom Title Bar to assign the knobs to adjust the zoom or tap the Cursors button to assign knobs to adjust the cursors.

    Double tap the Horizontal Zoom Position or Horizontal Zoom Scale fields to enter a value using a numerical keypad.

    To exit the zoom display mode, tap the Zoom icon in the corner of display or tap the X in the Zoom Title Bar.

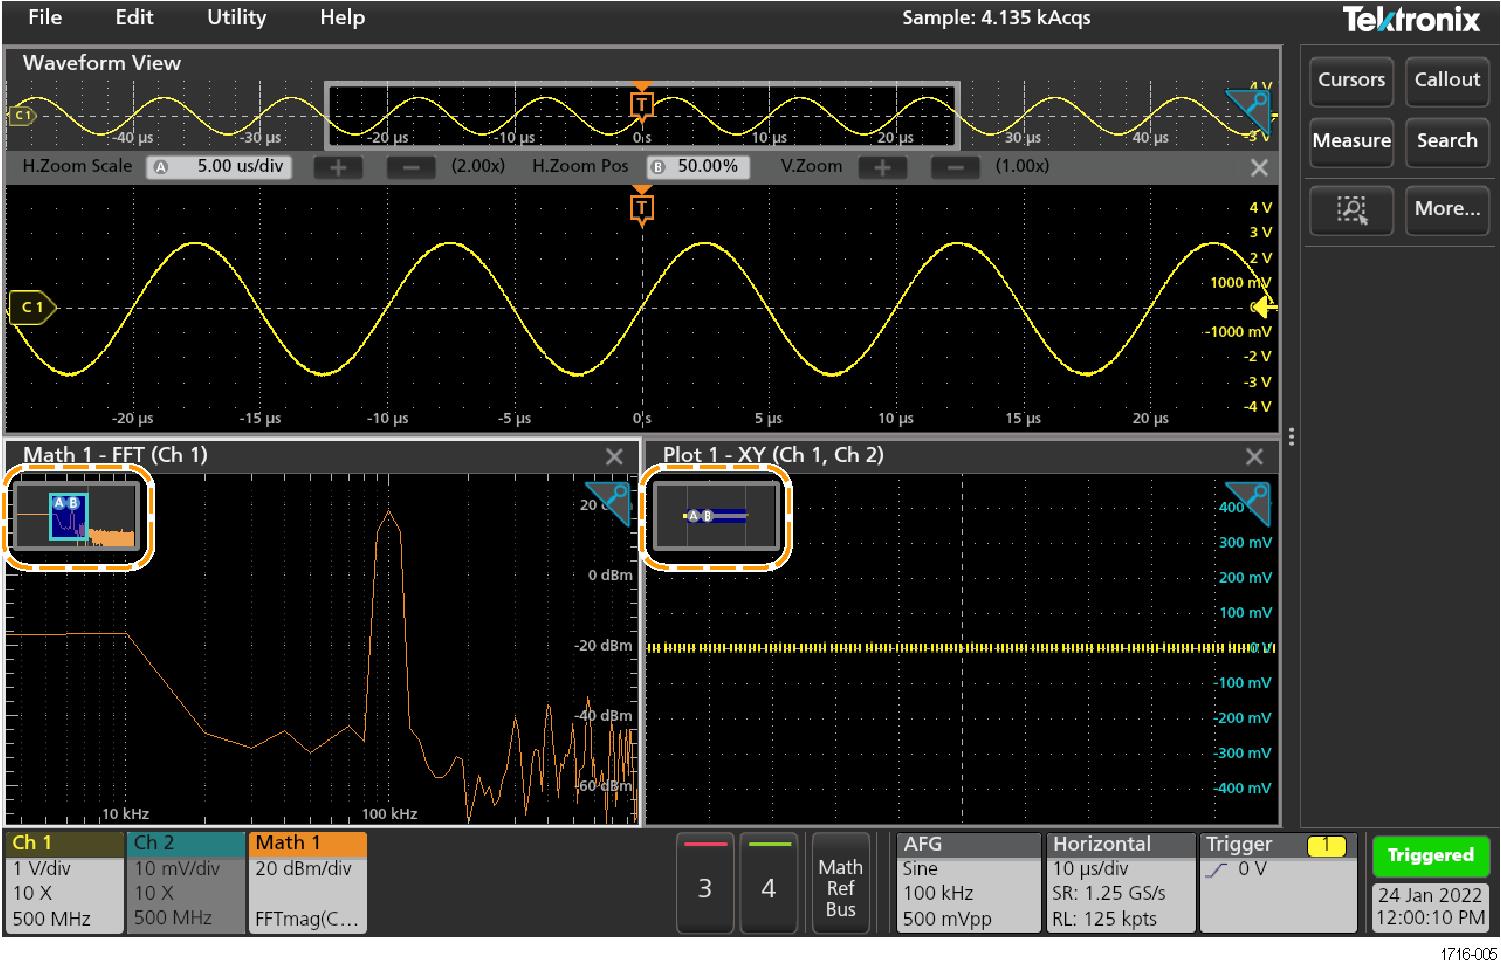
Math-FFT or XY plot view zoom

Use the A and B multipurpose knobs to adjust the zoom for Math-FFT or XY plot view.

In a Math-FFT or XY plot view, if A and B multipurpose knobs are assigned to Zoom, the zoom box is highlighted and the multipurpose knobs within the Zoom Box are enabled.

If both Cursors and Zoom are turned on in Math-FFT or XY Plot view, use the Zoom Box and Cursors button to change the multipurpose knob functionality. Tap the Zoom Box to assign the knobs to adjust zoom or tap the Cursors button to assign knobs to adjust the cursors .

To exit the zoom display mode, tap the Zoom icon in the corner of view or tap the X in the Math-FFT view or XY plot view.

Using the touch screen interface for common tasks

Use standard touch screen actions, similar to those found on smart phones and tablets, to interact with most screen objects. You can also use a mouse to interact with the UI. The equivalent mouse operation is shown for each touch operation.

The oscilloscope has a user interface tutorial. Tap Help > User Interface Tutorial to quickly learn the fundamental touch operations.

Table 1. Common touchscreen UI tasks with mouse equivalents
Task Touchscreen UI action Mouse action
Add a channel, math, reference, or bus waveform to the screen. Tap an inactive channel button, Add New Math, Add New Reference, or Add New Bus button. Click an inactive channel button, Add New Math, Add New Reference, or Add New Bus button.
Select a channel, math, reference, or bus waveform to make it active Stacked or Overlay mode: Tap the Channel or Waveform badge. Stacked or Overlay mode: Left-click the Channel or Waveform badge.
Stacked mode: Tap the channel, math, reference, or bus waveform slice or handle. Stacked mode: Left-click the channel, math, reference, or bus waveform slice or handle.
Overlay mode: Tap the channel or waveform handle. Overlay mode: Left-click the channel or waveform handle.
Display scale or navigation buttons on a badge (waveform, measurement, search, horizontal). Not all measurement or search badges display navigation buttons. Tap the badge. Click the badge.
Open a configuration menu on any item (all badges, views, cursor readouts, labels, and so on). Double-tap the badge, view, or other object. Double-click the badge, view, or other object.
Open a right-click menu (badges, views). Touch and hold on the badge, Waveform View, Plot view, or other screen item until a menu opens. Right-click the object.
Close a configuration menu. Some dialog boxes will not close until you click an OK, Close, or other button in the dialog. Tap anywhere outside the menu or dialog. Click anywhere outside the menu or dialog.
Move a menu. Touch and hold the menu title bar or a blank area in the menu, then drag the menu to new position. Click and hold the right mouse button on title or blank area, drag to new position.
Move a callout. Callouts are screen objects and are not associated with any particular waveform channel or slice. Touch and hold on a callout and quickly start to drag, then move to new position. Start to move the callout as soon as selected (highlighted), otherwise the UI opens the right-click menu.Click and hold the right mouse button on the callout and quickly start to drag, then move to the new position.
Change horizontal or vertical settings directly on a waveform. Vertical changes only apply to the selected channel or waveform; horizontal changes apply to all channels and waveforms. Tap a badge and use the Scale buttons. Left-click a channel, waveform, or Horizontal badge and click on the Scale buttons.
Touch and hold two fingertips on the waveform view, move them together or apart vertically or horizontally, lift from screen; repeat.
Increase or decrease the zoom area while in Zoom mode.Touch and hold two fingertips on the waveform view, move them together or apart vertically or horizontally, lift from screen; repeat. Click the + or - buttons on the Zoom Title bar.
Click the Draw-a-Box button, draw a box around the waveform area of interest.
Quickly scroll or pan a waveform or list. Touch and drag in the waveform or list. Click and drag in the waveform or list.
Close or open the Results Bar to increase the Waveform View area. Tap on the Results Bar Handle (three vertical dots in border) or anywhere in the border between the Waveform View and the Results Bar. Click the Results Bar Handle (three vertical dots in border) or anywhere in the border between the Waveform View and the Results Bar.
Click and drag the Results Bar divider.
Change the position of badges in the Settings Bar or Results Bar. Touch and drag the badge to a new position in the same bar. Click and drag the badge to a new position in the same bar.

Accessing application help

Use the instrument online help to quickly get information about a function or assistance in performing a task.

Using context-sensitive help

To open help on a particular menu or item, tap the Help button (question mark symbol) in the title bar. The browser opens with content relevant to the menu or item.

Navigating the online help

Select Help > Help. The Help Browser is similar in look and feel to PC-based Help tools.

Note:The Help tool does not have a virtual keyboard. Connect a keyboard to your instrument to enter text in the search fields of the Search or Index tabs.

From the help browser, select one of the following tabs:

  • Contents Tab. Click any entry to display information on the subject.
  • Search Tab. Type in the keyword you are looking for; then click List Topics. Every topic that contains the keyword will be displayed. Select a topic, and then click Display to open the topic.

Other help features

Zoom on help text. Use the magnifying glass icons to zoom in or out of the help text.

Configure the instrument

Configurations to help operate your instrument efficiently.

Download and install the latest instrument firmware

Installing the latest firmware helps ensure that your instrument has the latest features and is taking the most accurate measurements.

Before you begin

Save any important on-instrument files such as waveforms, screen captures, and setups to a USB drive or network. The installation process does not remove user-created files, but it is recommended to back up important files before an update.

Determine the current version of firmware installed on the instrument using the Help > About menu.

Procedure

To download the instrument firmware and install onto an instrument:
  1. Open up a Web browser on a PC and go to http://www.tek.com/product-support
  2. Enter the instrument model number in the search field and click Go.
  3. Scroll down the screen and click the Software tab.
  4. If the listed available firmware version (Windows or non-Windows) is newer than what is on your instrument, select and download that file to your PC.
  5. Copy the downloaded firmware file to a USB drive.
  6. Insert the USB drive with the firmware file into one of the USB ports on the instrument.
  7. Power on the instrument.

    For the battery operated instrument, connect the power cord and keep it connected during the upgrade of an instrument firmware.

  8. Follow on-screen instructions.
    The instrument will take a few minutes to install the new firmware. Do not remove the USB flash drive or power off the instrument during this time.

What to do next

To confirm the firmware update, locate the version number found in the About window under the Help menu. Confirm that the instrument firmware version number matches the firmware version number that you just installed.

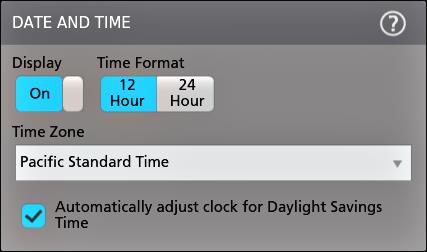
Set the time zone and clock readout format

Set the time zone to your region so that saved files are marked with the correct date and time information. You can also set the time format (12 or 24 hour clock).

Procedure

  1. Double-tap the Date/Time badge (bottom-right of screen) to open the configuration menu.
  2. To turn off showing the date and time on the screen, tap Display button to Off.
    To turn on date/time display again, double-tap in the blank area where the date/time badge was displayed to open the configuration menu, and set the Display button to On.
  3. Select a time format (12 Hour or 24 Hour).
  4. Tap the Time Zone field and select the time zone that applies to your location.
  5. Tap anywhere outside of the menu to close it.

Functional check

Use this procedure to quickly verify that the oscilloscope can display a waveform and take a measurement.

  1. Power on the oscilloscope.
  2. Tap Utility > Self test. Check that all tests listed show Pass.
  3. Connect an analog probe to the Channel 1 connector.
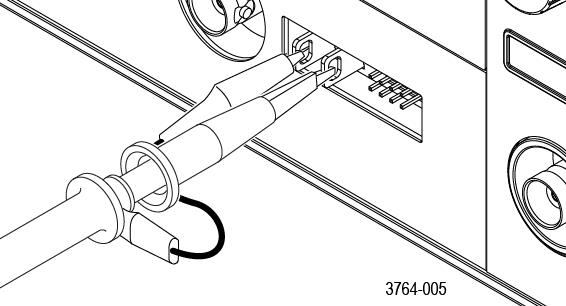
  4. Connect the oscilloscope tip and ground lead to the probe compensation connectors.
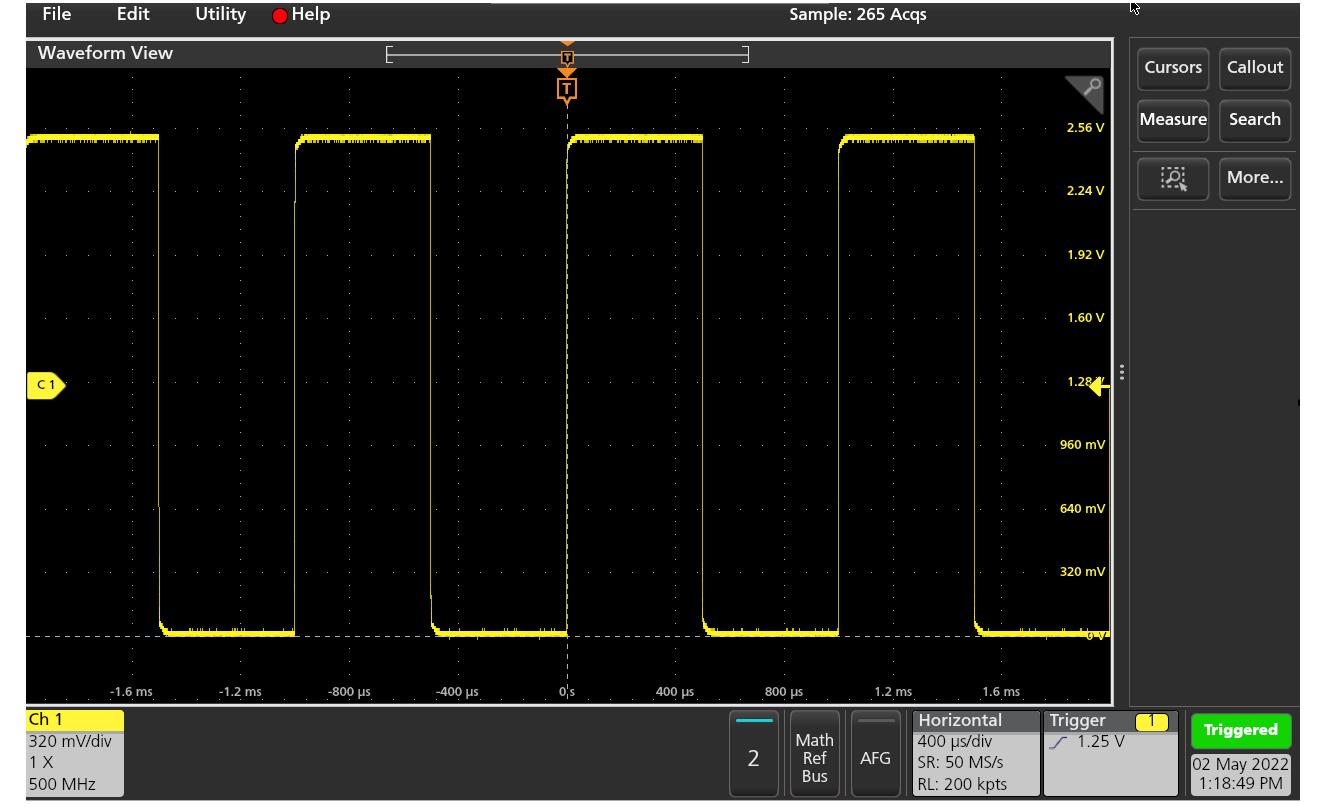
  5. Push the Autoset button. You should see a square wave in the display. The levels should be approximately 0 V - 2.5 V and 1 kHz.
  6. Tap the Measure button.
  7. Tap the Time Measurements panel in the Add Measurements configuration menu.
  8. Double-tap the Frequency button to add the frequency measurement to the Results bar.
  9. Check that the Frequency measurement reads 1 kHz.
  10. Repeat these steps to check the other channels on the oscilloscope. Make sure that you set the source in the Add Measurement configuration menu to use the correct channel before adding the Frequency measurement.

Run Signal Path Compensation (SPC)

Run SPC when you first receive an instrument, and at regular intervals, for best measurement accuracy. You should run SPC whenever the ambient (room) temperature has changed by more than 5 °C (9 °F), or once a week if you use vertical scale settings of 5 mV per division or less.

About this task

Signal Path Compensation (SPC) corrects for DC level inaccuracies in the internal signal path, caused by temperature variations and/or long-term signal path drift. Failure to run SPC on a regular basis may result in the instrument not meeting warranted performance levels at low volts per division settings.

Before you begin

Disconnect all probes and cables from the front-panel channel inputs and rear-panel signal connectors.

Procedure

  1. Power on and warm up the instrument for at least 20 minutes.
  2. Tap Utility > Calibration.
  3. Tap Run SPC. The SPC Status readout shows Running while SPC is running. SPC can take three minutes approximately per channel to run, so wait until the SPC Status message changes to Pass before reconnecting probes or cables and using the instrument.
    CAUTION:You can abort the SPC calibration by tapping Abort SPC. This may leave some channels uncompensated, resulting in possible inaccurate measurements. If you do abort the SPC, make sure to run the SPC procedure completely before using the instrument to take measurements.
  4. Close the Calibration configuration dialog when SPC has completed.If the SPC fails, write down any error message text. Make sure that all probes and cables are disconnected and run the SPC again. If the SPC still fails, contact Tektronix Customer Support.

Compensate the probe

Probe compensation adjusts the high frequency response of a probe for best waveform capture and measurement accuracy. Use this procedure to adjust probe compensation for probes with a manual adjustment.

The following procedure checks the probe compensation.

  1. Connect a supported probe to Channel 1.
  2. Connect the probe tip and ground lead of the probe to the PROBE COMP terminals. Connect only one probe at a time to the PROBE COMP terminals.

  3. Turn on the Channel 1 and turn off all other channels.
  4. Tap File > Default Setup.
  5. Push the Autoset button on the front-panel or tap File > Autoset from the menu bar. The screen should display a square wave with the levels between approximately 0 V - 2.5 V and 1 kHz.

  6. Check the shape of the displayed waveform to determine if the probe needs adjusted. If the waveform has a square leading edge and a flat top and bottom, the probe does not need adjusted. If the waveform leading edge is rounded or has a spike, you need to adjust the probe compensation.

  7. Use the probe adjustment tool provided with the probe to adjust the probe until the waveform has as flat a top and bottom as possible. Remove the adjustment tool before looking at the waveform. Repeat until waveform top and bottom are flat. See your probe manual for adjustment location and instructions.
  8. Repeat these steps for each probe connected to each channel. You must run this procedure every time you move a probe from one channel to another.

Connect to a network (LAN)

Connecting to a network allows you to remotely access the instrument.

Work with your network administrator to obtain the required information to connect to your network (IP address, Gateway IP address, Subnet Mask, DNS IP address, and so on).

  1. Connect a CAT5 cable from the instrument LAN connector to your network.
  2. Select Utility > I/O on the menu bar to open the I/O configuration menu.
  3. Obtain or enter the network address information:
    • If your network is DHCP-enabled, and the IP address field does not already show an address, tap Auto to obtain the IP address information from the network. DHCP mode is the default mode.
    • If your network is not DHCP-enabled, or you need a permanent (non-changing) IP address for this instrument, tap Manual and enter the IP address and other values provided by your IT or system administrator resource.
  4. Tap Test Connection to verify that the network connection is working. The LAN Status icon turns green when the instrument successfully connects to your network. If you have problems connecting to your network, contact your system administration resource for help.

Mount a network drive from a standard instrument

Use this procedure to mount (map) a network Linux mount point shared directory on a standard (non Windows OS) instrument.

Prerequisites: The oscilloscope must be connected to a network that has access to the directories to mount or unmount. See Connect to a network (LAN).

To mount a Linux network drive on the oscilloscope, the network Linux mount point (drive, host) that you want to mount must be exported. If the mount point is not exported, work with your organization's IT resource to get that location exported and accessible to your network.

To mount a network drive on your standard oscilloscope:
  1. Tap File > File Utilities.
  2. Tap Mount to open the Mount Drive menu.
  3. Select Network in the Drive Type.
  4. Select the drive letter to assign to the network drive from the Drive Letter list.
  5. Tap Name or IP to specify how you will enter the host name (server) of the network mount location or PC.
  6. Enter the network host name or IP address of the Linux mount point or Windows PC or server in the Server Name or Server IP Address field. Example: ACME-PC0205
  7. Enter the path to the location of the mount point or shared directory of the server in the Path field.

    Linux example: /opt/testing/batch1 (Linux requires forward slashes in path definitions. Linux assumes that the path starts at the root directory.

  8. If access to this network location is controlled, enter the required information in the User Name, Password, and Domain/Workgroup fields.
  9. Tap OK. The oscilloscope mounts the drive and adds the specified drive letter to the Drive column in the File Utilities menu.

    The oscilloscope displays an error message if it cannot mount the drive. Work with your organization's IT resource to verify that the access information is correct and to resolve the network access problems.

    CAUTION:The Linux ScopeApp does not support SMB version 1.0 for CIFS network mounts.

Mount TekDrive

TekDrive is a collaborative T&M data workspace provided with the purchase a supported Tektronix product.

Before you begin

You must have internet connectivity access to perform this procedure.

Browse to http://drive.tekcloud.com, register, and create a new account.

  • The TekDrive mount feature is supported on 2 Series MSO instruments.
  • The maximum upload file size limit to TekDrive is restricted to 25 GB.
  • When the TekDrive is enabled, you cannot copy and paste for files and folders in the TekDrive.
  • In some scenarios, recalling the files from the TekDrive is not supported and you will not see it listed in the file browser, but you can continue recalling the file through USB/Network or Local drives. For example, Math Filter files cannot be recalled/applied from the Math advanced menu if it is stored in the TekDrive.
  • When a TekDrive is unmounted or auto-disconnected, the waveform files activated from it would continue to work until you recall the defaults, run TekSecure®, or change the reference waveform file.

About this task

Use TekDrive to upload, store, organize, search, download, and share arbitrary files from any connected device. Use the following procedure to mount (map) a TekDrive.

Procedure

  1. Tap File > File Utilities.
  2. Tap Mount to open the Mount Drive menu.
  3. Select the TekDrive button under Drive Type
  4. Enter the Drive Name.
  5. Select the required Auto Disconnect option.
  6. Tap Connect to TekDrive to display the window with the QR and numeric code for TekDrive activation.
  7. Browse to drive.tekcloud.com/activate to login using your credentials and enter the numeric code displayed in the Mount Drive window.
    Register and create a new account if you are a new user.
    A message is displayed when activation is successful.
  8. After activation, click OK, mount Tekdrive to complete the mounting process.
    The connected TekDrive is available in all file browsing windows.

Unmount a network drive from a standard instrument

Use this procedure to unmount (remove, disconnect) a network Linux mount point from a standard (non-Windows 10) instrument.

To unmount a network drive from your instrument:
  1. Tap File > File Utilities.
  2. Select the drive to unmount in the Drive column.
  3. Tap Unmount. The instrument immediately unmounts the drive and removes it from the Drive column.

Unmount a TekDrive

Use this procedure to unmount (remove, disconnect) a TekDrive.

Procedure

  1. Tap File > File Utilities.
  2. Select the TekDrive to unmount in the Drive column.
  3. Tap Unmount.
    The drive is unmounted and it is removed from the Drive column.

Connect the oscilloscope to a PC using a USB cable

Use a USB cable to connect the oscilloscope directly to a PC for remote instrument control.

  1. On the oscilloscope, select Utility > I/O from the menu bar.
  2. Tap USB Device Port Settings.
  3. Confirm that the USB Device Port control is On (default setting).
  4. Connect a USB cable from the PC to the USB Device port on the instrument.

Deskew analog input channels - quick visual method

Use the following procedure to visually align waveform edges to compensate for timing differences between probes.

Critical Time measurements on multiple channels require that all probes be adjusted, or deskewed, to compensate for signal timing differences between probes. This procedure uses displayed waveform edges to quickly minimize deskew between probes.

Note:Once probes have been deskewed for a particular channel, you should only use the probes on the channels for which they were deskewed, when taking critical Time measurements.
  1. Connect all probes that you want to deskew.
  2. Connect up to four probe tips and ground leads to the Probe Compensation connector (maximum of four channels at a time).
  3. Turn on (display on screen) the connected channels that you want to deskew.
  4. Double-tap in the Waveform view and set Waveform Mode to Overlay.
  5. Push the Autoset button.
  6. Adjust the vertical Scale and Position controls for each channel so that the signals overlap and are centered on the display.
  7. Adjust the horizontal Scale so that the differences in the channel delays are clearly visible.
  8. Determine the channel you want to use as your reference.
  9. Double-tap the Channel badge of a channel other than the reference channel and tap the Other panel.
  10. Tap the Deskew field and use the multipurpose knob to align this channel with the reference channel waveform such that the waveforms cross the trigger point at the same time. For fine adjust, double-tap the Deskew field to open a number pad.
  11. Repeat steps 9 and 10 for each additional channel you want to deskew.
  12. To deskew additional channels:
    1. Disconnect all probe tips except the reference probe from the Probe Compensation connections.
    2. Connect up to three probe tips and ground leads to the Probe Compensation connector (maximum of four channels at a time).
    3. Repeat steps 3 through 12 for the additional channels to deskew.

Deskew analog input channels

Critical Time measurements on multiple channels require that all probes be adjusted, or deskewed, to compensate for signal timing differences between probes.

Note:Once probes have been deskewed for a particular channel, you should only use the probes on the channels for which they were deskewed, when taking critical Time measurements.

Measurement method

Use the following procedure to more accurately minimize timing differences between probes.

  1. Connect all probes that you want to deskew to the oscilloscope.
  2. Connect up to four probe tips and ground leads to the Probe Compensation connector (maximum of four channels at a time).
  3. Turn on all the channels of the first four channels that you want to deskew.
  4. Push the Autoset button.
  5. Change the vertical Scale of all active channels to 500 mV/div and adjust the vertical Position so that the waveforms are centered in their respective slices.
  6. Determine the channel you want to use as your reference.
  7. Tap the Measure button and tap the Time Measurements panel.
  8. Select the Delay measurement and set your chosen reference channel as Source 1 and your channel being deskewed as Source 2, then tap the Add button.
  9. Double-tap the Channel badge of the channel being deskewed (Source 2) and tap the Other panel.
  10. Tap the Deskew field and use the multipurpose knob to align this channel with the reference waveform such that the measured delay between channels becomes a minimum. For fine adjust, double-tap the Deskew field to open a number pad.
  11. Double-tap the Delay measurement badge and set the Source 2 channel to the next channel to deskew.
  12. Repeat steps 9 through 11 for each additional channel you want to deskew in the first set of four.
  13. To deskew additional channels:
    1. Disconnect all probe tips except the reference probe from the Probe Compensation connections.
    2. Connect up to three probe tips and ground leads to the Probe Compensation connector (maximum of four channels at a time).
    3. Repeat steps 3 through 13 for the additional channels to deskew.

Quick visual method

Use the following procedure to visually align waveform edges to compensate for timing differences between probes.

  1. Connect all probes that you want to deskew.
  2. Connect up to four probe tips and ground leads to the Probe Compensation connector (maximum of four channels at a time).
  3. Turn on (display on screen) the connected channels that you want to deskew.
  4. Double-tap in the Waveform view and set Waveform Mode to Overlay.
  5. Push the Autoset button.
  6. Adjust the vertical Scale and Position controls for each channel so that the signals overlap and are centered on the display.
  7. Adjust the horizontal Scale so that the differences in the channel delays are clearly visible.
  8. Determine the channel you want to use as your reference.
  9. Double-tap the Channel badge of a channel other than the reference channel and tap the Other panel.
  10. Tap the Deskew field and use the multipurpose knob to align this channel with the reference channel waveform such that the waveforms cross the trigger point at the same time. For fine adjust, double-tap the Deskew field to open a number pad.
  11. Repeat steps 9 and 10 for each additional channel you want to deskew.
  12. To deskew additional channels:
    1. Disconnect all probe tips except the reference probe from the Probe Compensation connections.
    2. Connect up to three probe tips and ground leads to the Probe Compensation connector (maximum of four channels at a time).
    3. Repeat steps 3 through 12 for the additional channels to deskew.

Connect a keyboard or mouse

The instrument supports most standard USB-connected keyboards and mice, and wireless-connected keyboards and mice (using a USB-connected dongle).

Connect a keyboard and/or mouse by connecting their USB cable, or USB dongle, into any available USB Host port. The keyboard or mouse should work immediately. If it does not, try the following:
  1. Remove and reinsert the USB cable or dongle in the same port.
  2. Insert the USB cable or dongle into a different USB port.

ESD Prevention Guidelines

Electrostatic discharge (ESD) can damage oscilloscope and some probe inputs. This topic discusses how to avoid this type of damage.

Electrostatic discharge (ESD) is a concern when handling any electronic equipment. The instrument is designed with robust ESD protection, however it is still possible that large discharges of static electricity directly into the signal input may damage the instrument. Use the following techniques to prevent electrostatic discharge from damaging the instrument.

  • Discharge the static voltage from your body by wearing a grounded antistatic wrist strap while connecting and disconnecting cables, probes, and adapters. The instrument provides a ground connection to which to attach a wrist strap (on the Probe Comp ground connector).
  • A cable that is left unconnected on a bench can develop a large static charge. Discharge the static voltage from all cables before connecting them to the instrument or device under test by momentarily grounding the center conductor of the cable, or by connecting a 50 Ω termination to one end, before attaching the cable to the instrument.
  • Before you apply power, connect the instrument to an electrically-neutral reference point, such as earth ground. To do this, plug the three-pronged power cord into an outlet grounded to earth ground. Grounding the oscilloscope is necessary to ensure safety and to take accurate measurements.
  • If you are working with static sensitive components, ground yourself. Static electricity that builds up on your body can damage static-sensitive components. Wear a wrist strap to safely send static charges on your body to earth ground.
  • The oscilloscope must share the same ground as any circuits that you plan to test.

Analog channel operating basics

Acquiring a signal

After acquiring a signal you can take measurements and plot the results.

Use the following procedure to set the scale and position parameters for analog signal acquisition.

  1. Press the Default Setup button.
  2. Connect the probe output to the desired oscilloscope channel, and connect the probe input to the input signal source using proper probing/connecting techniques.
    Note:Some probes automatically set their termination and other values.
  3. Tap the channel button to add the channel waveform to the waveform view and add a channel badge to the setting bar. A channel button lights when its channel is on.
  4. Double-tap the channel badge to open the channel Vertical Settings menu. To change the input coupling, select the appropriate coupling button.
    • Select DC to couple both the AC and DC components of an input signal.
    • Select AC to couple only the AC components of an input signal.
  5. Use the Vertical knobs to scale and position the waveform vertically on the screen. The Knobs should be highlighted with the active channel's color. Dragging the waveform handle also positions the waveform.
  6. Use the Vertical Settings menu to change the offset. Tap Offset, and then use a multipurpose knob to adjust the offset.
  7. Use the Horizontal knobs to scale and position the waveform horizontally on the screen and to set the record length. Dragging the reference icon also positions the waveform.
  8. Use the Horizontal menu to set the record length and sample rate (when in Manual mode).
  9. You may attempt to stabilize the display by pressing the trigger Level knob to set the trigger level to 50%. The 50% level is calculated as the midpoint between the highest and lowest samples of the acquired waveform. If your signal is periodic you should see a stable, triggered signal. This method will not work as well with random signals.

Autoset to quickly display a waveform

The Autoset function analyzes the signal characteristics and changes the instrument Horizontal, Vertical, and Trigger settings to automatically display a triggered waveform. You can then make further changes to trigger and horizontal settings to view the waveform point of interest.

  1. Connect the probe with the signal of interest to an available channel.
  2. Double-tap the Trigger badge and set the trigger source to that of the signal of interest.
  3. Connect any other associated signal(s) to available channel input(s).
  4. Add the channel waveforms to the Waveform view. See Add a channel waveform to the display.
  5. Tap File > Autoset or push the front-panel Autoset button. When using the Stacked Display mode, the instrument analyzes the signal characteristics of the trigger source channel (analog or digital) and adjusts the horizontal, vertical, and trigger settings accordingly to display a triggered waveform for that channel. The Vertical scale is adjusted in each waveform slice of all active waveforms to maximize ADC utilization.

    When using the Overlay Display mode, the instrument adjusts the horizontal and trigger settings of the trigger source channel to display a triggered waveform for that channel. Vertical scale and position adjustments for all active channels in Overlay Display mode are controlled by the Autoset in Overlay Display Mode Optimizes selection in the Autoset panel of the User Preferences menu. If the selection is Visibility, Autoset vertically scales and positions all active channel waveforms such that they are uniformly spaced on screen. If the selection is Resolution, Autoset vertically scales and positions all active channel waveforms such that they each use as much of the ADC's range as possible.

    Note:You can set which parameters the instrument can adjust when running an Autoset. Access the Autoset panel in Utility > User Preferences > Autoset.

Autoset guidelines

  • Autoset displays three or four cycles (depending on the detected signal) with the trigger level near the midlevel of the signal.
  • The trigger is set to type Edge, rising slope, DC coupling.
  • If no channels are displayed before pushing Autoset, the oscilloscope adds Ch 1 to the Waveform view whether it has a signal or not.
  • Autoset ignores math, reference, and bus waveforms.
  • A channel or waveform with a frequency less than 40 Hz is classified as no signal.

Set Horizontal parameters

Use this procedure to set the horizontal time base parameters such as mode, minimum sample rate, horizontal scale, delay, and trigger delay time (relative to the center of the waveform record.

  1. Double-tap the Horizontal badge on the Settings bar to open the Horizontal configuration menu.

  2. Use the menu selections to set horizontal parameters.
  3. Tap the Help icon on the menu title for more information on these settings.

How to trigger on a signal

Use this procedure to open the Trigger menu to select and configure the trigger event type and conditions.

  1. Double-tap the Trigger badge on the Settings bar to open the Trigger configuration menu.
  2. Select a trigger from the Trigger Type list. The trigger type sets what fields are available in the menu and also updates the illustration to show a graphic of the trigger type.

    To trigger on a bus, you must first add the bus to the Waveform view. See Add a math, reference, or bus waveform

    Note:Triggering on buses other than Parallel requires purchasing and installing serial trigger and analysis options.
  3. Select the other fields and panels to refine the trigger conditions. The menu fields and trigger graphic updates as you make changes to the trigger settings. Displayed fields depend on the selected trigger type. Selection changes take effect immediately.

  4. Tap the Help icon on the menu title for more information on these settings.
  5. Tap outside the menu to close the menu.

Set the acquisition mode

Use this procedure to set the method the instrument uses to acquire and display the signal.

  1. Double-tap the Acquisition badge on the Settings bar to open the Acquisition configuration menu.
  2. Select the acquisition method from the Acquisition Mode list. Set any other parameters associated with the selected acquisition type.

  3. Tap the Help icon on the menu title for more information on these settings.
  4. Tap outside the menu to close the menu.

Start and stop an acquisition

Acquisition controls the start and stop of waveform acquisition.

  1. To start an acquisition, double-tap the Horizontal configuration menu, tap the Acquisition Settings on the Settings bar. Tap Run/Stop in the Acquisition configuration menu.
  2. Tap the Stopped button on the setting bar to run the acquisition again. You can also push the Run/Stop button on the front panel.

  3. To stop an acquisition, tap Run/Stop again or push the Run/Stop button. Tap the Running button on the setting bar to stop the acquisition.
  4. To take a single acquisition, double-tap the Horizontal configuration menu, tap the Acquisition Settings on the Settings bar.
  5. Tap Single/Seq in the Acquisition configuration menu, or push the Single/Seq button on the front panel.
  6. The color of the Run/Stop and Single/Seq buttons on the front panel indicate the acquisition status (green = acquiring, red = stopped).
  7. To clear the current acquisition data from waveform memory, double-tap the Acquisition badge and tap Clear in the Acquisition configuration menu, or push the Clear button on the front panel.

Add a channel waveform to the display

Use this procedure to add a channel signal to the Waveform View.

  1. Connect signal(s) to the channel input(s).
  2. Tap an Inactive Channel button (in the Settings bar) of a connected channel.

    The selected channel is added to the Waveform View and a Channel badge is added to the Settings bar.

  3. Continue tapping Inactive Channel buttons to add more channels (digital or analog). Channels are displayed from lowest-numbered channel at the top, to highest-numbered channel at the bottom of the view, regardless of the order they were added (in stacked mode).

  4. Double-tap a channel badge to open that channel's configuration menu to check or change settings.

Configure channel or waveform settings

Use the channel and waveform configuration menus to set parameters such as vertical scale and offset, coupling, bandwidth, probe settings, deskew values, external attenuation values, and other settings.

Before you begin

Prerequisite: There is a channel or waveform badge in the Settings bar.

Procedure

  1. Double-tap a Channel or Waveform badge to open a configuration menu for that item.
    For example, in a Channel menu, use the Vertical Settings panel to set basic probe parameters such as vertical scale and position, offset, coupling, termination, and bandwidth limit. Available settings depend on the probe.

  2. Tap the Probe Setup panel to confirm probe settings and run configuration or compensation on supported probes.


  3. Tap the Help icon on the menu title to open the help topic for more information.
  4. Tap outside the menu to close the menu.

Add a math, reference, or bus waveform

Math waveforms let you create new waveforms based on operations between two or more waveforms or by applying equations to waveform data. A reference waveform is a static waveform record displayed for comparison. Bus waveforms let you view and analyze serial or parallel data.

There is no set limit to the number of Math, Reference, or Bus waveforms you can add to the Waveform View, other than system physical memory constraints.
  1. Tap the Math Ref Bus > Add New Math, Add New Ref, or Add New Bus button in the Settings bar.

  2. The instrument adds the waveform to the Waveform view, adds a Waveform badge to the Settings bar, and opens a configuration menu. This example shows adding a Math waveform.

  3. Use the configuration menus to refine the waveform parameters. Displayed fields depend on the waveform and selections made in the menu. Selection changes take effect immediately.

    This example shows adding a Math waveform, using the Math Source fields to select Ch 1 and Ch 2 as the waveform sources, set the math type to Basic math operation, and subtracting channel 2 from channel 1.


  4. When adding a Reference waveform, the instrument displays a Recall configuration menu. Navigate to and select the reference waveform file (*.wfm) to recall, then tap the Recall button. The instrument displays the Reference waveform.
  5. Double-tap a math, reference, or bus badge to check or change the waveform settings.
  6. Tap the Help icon on a configuration menu title for more information on math, reference, and bus waveform settings.
  7. Tap outside the menu to close the menu.

Add a measurement

Use this procedure to select and add measurements.

  1. Acquire the channel(s) and/or waveform(s) on which you want to take measurements.

    Note:Waveforms do not need to be displayed to be used for measurements, as long as the channel or waveform badge is on the Settings bar and is acquiring the signal to measure.
  2. Tap the Measure button to open the Add Measurements configuration menu or drag the Measure button onto a waveform in the waveform display area to automatically set the source.

    Note:If the menu shows tabs other than Standard, then optional measurement types have been installed on the instrument. Select a tab to show the measurements for that option.
  3. Tap the Source field and select the measurement source. The list shows all available sources that are valid for the measurement.

  4. Select a measurement category panel, such as Amplitude Measurements or Time Measurements, to display measurements for those categories.
  5. Select a measurement and tap Add to add the measurement to the Results bar. You can also double-tap a measurement to add it to the Results bar.

  6. Select and add other measurements for the current source. Tap the measurement category panels to display and select other measurements to add.
  7. To add measurements for other sources, select a different source, select a measurement, and add the measurement.

  8. Tap outside the Add Measurements menu to close the menu.
  9. To further adjust a measurement's settings, double-tap a measurement badge to open a configuration menu for that measurement. See Configure a measurement.
  10. Tap the Help icon on the menu title for more information on settings.

Configure a measurement

Use this procedure to add statistical readouts to the measurement badge, display plots for the measurement, and refine measurement parameters (configuration, global versus local scope of settings, gating, filtering, and so on).

  1. Double-tap a measurement badge to open its Measurement configuration menu.

  2. Tap Show Statistics in Badge to add statistical readouts to the measurement badge.

  3. Tap available panel titles to make changes for those categories.

  4. Use the available fields to refine the measurement conditions. Displayed fields depend on the measurement. Selection changes take effect immediately. Selection changes can also change fields in other panels.
  5. Tap the Help button on the menu title for more information on this menu's settings.
  6. Tap outside the menu to close the menu.

Delete a Measurement or Search badge

Use this procedure to remove a Measurement or Search badge from the Results bar.

  1. Touch and hold the Measurement or Search badge that you want to delete. The instrument opens a right-click menu.
  2. Select Delete Meas to delete that badge from the Results bar.

    Note:You can undo a measurement delete.
  3. The second way to delete a Measurement or Search badge is by flicking it off the right edge of the display. Flicking to the left from the right edge of the display recovers the badge.
Note:Badge recovery is possible within 10 seconds only of removal.

Display an XY plot

Use this procedure to display an XY plot.

  1. Double-tap Horizontal badge on the Setting bar.
  2. Tap the Acquisition Settings panel.
  3. Tap XY to On. The plot is added to the screen.
  4. Double-tap in the Plot view to open a configuration menu for that plot.

Display an FFT math waveform

Use this procedure to display an FFT math waveform.

The FFT process mathematically converts the standard time-domain signal (repetitive or single-shot acquisition) into its frequency components. The FFT function processes the waveform record and displays the FFT frequency domain record, which contains the input signal frequency components from DC (0 Hz) to ½ the sample rate (also called the Nyquist frequency).

  1. Tap Add New Math to create a math waveform and open the Math configuration menu.
  2. Tap Source and select the signal source from the list.
  3. Set Math Type to FFT. The FFT of the waveform is displayed in an FFT Math waveform view.
  4. Double-tap on the FFT waveform display to open a configuration menu to further refine the FFT display.

Add a serial bus to the Waveform view

Use this procedure to add a serial bus to the Waveform view.

This instrument supports decoding parallel buses (standard with the instrument) and several serial buses options. All serial bus functions are options that must be purchased and installed before they are available in the instrument menus.

Use a Bus configuration menu to define a bus from which to acquire, decode, and display data.

  1. Tap the Math Ref Bus > Add New Bus button on the Settings bar to add a Bus badge to the Settings bar, add a bus waveform to the screen, and open the Bus configuration menu. The default bus type is parallel.

  2. Tap Bus Type and select the bus type from the drop-down list.

  3. Use the fields and controls to select the bus signal sources, thresholds, other parameters, and the output format. The following image shows the settings for an I2C serial bus.

    The decoded bus is updated on the screen as you make changes to the settings.

  4. Tap outside of the Bus configuration menu to close it.
  5. Double-tap the Trigger badge and use the Trigger configuration menu to trigger on a specific condition in the bus.

  6. For more information on serial bus settings, tap the Help button on the Bus configuration menu.

Add a parallel bus to the Waveform view

Use this procedure to add a parallel bus to the Waveform view.

When you acquire data from a Parallel bus, you can set up the bus to be clocked or unclocked. If the bus is not clocked, the instrument acquires all data from the parallel bus at the sample rate of the instrument.
  1. Tap the Math Ref Bus > Add New Bus button on the Settings bar. This adds a Bus badge bus to the Settings bar, adds a bus waveform to the screen, and opens the Bus configuration menu. The default bus type is parallel.

  2. If setting up a clocked bus:

    1. Set Clocked Data to Yes.
    2. Tap the Clock Source field and select the source for the parallel bus clock signal.
    3. Tap the Polarity and Threshold controls and set the clock signal transition to detect and threshold level, respectively.
  3. Tap Define Inputs and select the signal sources for the parallel bus. Signal sources can be analog, math, or reference. Tap a signal in the Sources list to add it to the bus list on the left.


    The bus waveform updates as you make changes on the configuration menu. Tap the + symbol next to the waveform handle to turn on and off showing the signals associated with the bus waveform.


  4. Use the rest of the fields and controls in the configuration menu to set up the parallel bus parameters (label, position, display and decode formats).
  5. Tap outside of the Bus configuration menu to close it.
  6. To get a stable triggered waveform, double-tap the Trigger badge, set the Trigger Type to Bus, select the bus Source to the parallel bus you just set up, and enter the data condition on which to trigger in the Data field.
  7. For information on parallel bus menu settings, tap the Help button on the Bus configuration menu.

Add a Search

Use this procedure to set search criteria and mark a waveform where those events occur.

You can search on analog and digital signals, math waveforms, and reference waveforms. You can add searches to different waveforms and multiple searches to the same waveform.

Prerequisite: Display the channel or waveform signal on which to search. The waveform must be displayed to create a search for it.

  1. Tap the Search button to open the Search configuration menu.
  2. Use the configuration menu fields to set the search criteria in the same way that you would set for a trigger condition (select the Search Type, Source, and conditions on which to search).
    Note:You cannot search for sequential events (there is no Sequence search type).
  3. The searched waveform is marked with one or more triangles as soon as the search criteria becomes true. Each search uses a different color for its markers. The example image shows search criteria set to find positive pulse widths that are less than 70 ns wide.

  4. To stop showing marks on a waveform, double-tap the Search badge and tap Display to Off.
  5. To move the waveform to center marks on the display, push the Run/Stop front panel button to stop acquisition, single-tap a Search badge, and tap the < or > Navigation button.

    Note:Navigation buttons are only functional when the oscilloscope acquisition mode is set to Stop.

    This opens the Zoom mode and moves the waveform to the previous or next event mark on the waveform.

  6. If available for a search, tap the Min or Max button to center the waveform in the display at the minimum or maximum value of the search events in the waveform record.
  7. To return the instrument to normal acquisition mode, push the Run/Stop front-panel button to set it to Run mode.

Change waveform view settings

Use this procedure to change the waveform display mode (Stacked or Overlay), waveform trace interpolation algorithm, waveform persistence, style and intensity, and graticule style and intensity.

  1. Double-tap on an open graticule area to open the Waveform View configuration menu.

  2. Tap the buttons in the Display Mode to toggle between Overlay and Stacked modes.

  3. Use the other controls to set the waveform interpolation algorithm, waveform point persistence, style, and intensity, and graticule style and intensity.
  4. Tap the Help icon on the menu title to open the Waveform View menu help topic for more information on the waveform view parameters.
  5. Tap outside the menu to close the menu.

Display and configure cursors

Cursors are on-screen lines that you can move to take measurements on specific parts of a waveform or between two different waveforms. Cursor readouts show both current position values and the difference (delta) between cursors. Polar cursor readouts are available through the cursor configuration menu for XY plots.

  1. Tap the waveform slice (in Stacked mode), or the channel or waveform badge (in Overlay mode) to which you want to add cursors.
  2. Tap the Cursors button. The cursors are added to the display.

  3. Use Multipurpose Knobs A and B to move the cursors, or touch and drag a cursor. Cursors show readouts that show position and difference measurements between the cursors.
  4. To move the cursors to a different channel or waveform, just tap in that waveform graticule.

  5. To further configure cursors, double-tap on either cursor line or the cursor readouts to open the Cursors configuration menu. For example, tap the Cursor type to select the cursors to display, such as Waveform, V Bars, H Bars, and V&H Bars.

    The cursor configuration menu in the waveform view.


    The cursor configuration menu in an XY plot.

  6. To split the cursors between two waveforms, tap the Source field and select Split and select the source for each cursor. The cursors are moved to the specified waveforms.

  7. Tap the Help icon on the menu title for more information on the menu settings.
  8. To stop showing cursors, open the Cursors configuration menu and set Display to Off.

Using Default Setup

Use Default Setup to restore instrument settings to their factory defaults.

  1. Press the front panel Default Setup button to return the instrument to its factory default settings (horizontal, vertical, scale, position, and so on).
  2. You can also select File > Default Setup to restore default settings.

Add a callout to a view

Tap the Callout button to add callouts at the default position, but you can relocate it later.

  1. Tap the Callout button on the upper right of the results bar. The oscilloscope adds a text placeholder with default text as Double tap to edit at the center of the screen. However, you can move it around to place it at your choice.
  2. The default callout field wraps text at about 15 characters. Use a mouse to select the callout and select any point from the available 8 touch points to resize the callout field to a larger size, to autowrap the callout text for the longer callout.

  3. Double-tap or Double-click on the callout text top to open the callout Settings configuration menu.

  4. Select the type of callout from the drop-down list. The types of callout available are as follow:
    Callout Type Description
    Note Adds a callout as a text.
    Arrow Adds a callout text with an arrow.
    Rectangle Adds a callout text with an arrow pointing to a rectangle. The rectangle can be dragged to any position.
    Bookmark Adds a callout text with a bookmark added for either Waveform view (ch, math, ref), Spectrum view (freq domain traces, rf vs time domain traces), or Time Trends. Specify the source channel from the drop-down list and X-position of the callout.
  5. Tap in the Text field and use a keyboard to enter the callout text, or double-tap in the Text field and use the on-screen keyboard to enter the callout text.
    Note:You can enter only one row of text in the Text field of the Text Settings configuration menu (using an attached keyboard). You can enter multiple rows using the on-screen keyboard entry field.
  6. If you used the on-screen keyboard to enter text, tap the Enter button on the keyboard to close the keyboard and show the callout on the screen.
  7. Use the format menu controls to set font type, size, color and other characteristics. See Text Settings configuration for details.

  8. Tap outside the callout Settings configuration menu to close it.
  9. To move a callout, touch and drag the callout text to a new position.

Delete a Callout

Tap and hold on a callout text to open a menu to delete that Callout.

  1. Touch and hold on the callout text you want to delete (or right-click with the mouse). The oscilloscope opens the right-click menu.
  2. Select Delete. The callout is deleted immediately.

Acquiring digital signals

Connect a P6316 digital probe to a oscilloscope input channel. Connect the probe inputs to the DUT (see the probe instructions). Then use the following instructions to set up, acquire and display digital signals.

Connect and set up digital signals

Use the digital channel configuration menu to set the digital channels to acquire signals.

CAUTION:To prevent damage to the instrument always wear an antistatic wrist strap when making connections to the instrument and DUT. Always observe the maximum input voltage ratings for input connectors.
  1. Connect the P6316 digital logic probe to the instrument.
  2. Connect the probe to the signal sources. Use the accessories in the Tektronix Probe Accessory Kit (shipped with the probe) to connect to your DUT.
  3. Push the Digital button on the front panel to open the digital channel configuration menu. Set up digital channels to match your digital logic requirements.

  4. Tap Display to toggle the digital channel group On or Off.
  5. To change the displayed height of the digital channels, tap a Height button. The height settings are only available when the display mode is set to Overlay in the Waveform View configuration menu.
  6. Use the upper Label field to enter a custom label for the overall digital channel. Double-tap on the field and use the virtual keyboard or tap the field and use an attached keyboard.
  7. Tap the Bit control to toggle individual digital channel bits On or Off and remove them from the displayed logic waveform.
  8. Use the bit Label fields to enter labels for the individual digital channel bits (D0-D15). Double-tap on the field and use the virtual keyboard or tap the field and use an attached keyboard.
  9. Tap D15-D8 Turn All Off or D7-D0 Turn All Off to turn all digital bits Off.
  10. To set all bit thresholds to the same value for D15-D8 or D7-D0 bits, enter a threshold value in the Thresholds field.

Advanced triggering

You can check the advanced trigger status in the trigger menu. The menu indicates the trigger type and then shows sources, levels, or any other parameters that are important for the particular trigger type.

Triggering concepts

User selected trigger conditions are used to capture waveforms for measurement and analysis.

The next figure shows how triggers fit into the overall instrument operation.


Trigger helps you to capture meaningful waveforms to display on screen. This instrument has simple edge triggers as well as a variety of advanced triggers.


The trigger event

The trigger event establishes the time-zero point in the waveform record. All waveform record data are located in time with respect to that point. The instrument continuously acquires and retains enough sample points to fill the pretrigger portion of the waveform record (that part of the waveform that is displayed before or to the left of the triggering event on screen).

When a trigger event occurs, the instrument starts acquiring samples to build the post-trigger portion of the waveform record (displayed after or to the right of the trigger event). Once a trigger is recognized, the instrument will not accept another trigger until the acquisition is complete and the holdoff time has expired.

Trigger on a pulse width event

Pulse-width triggering triggers the oscilloscope when a signal pulse width is less than, greater than, equal to, or not equal to a specified pulse width. This trigger is useful for digital logic troubleshooting.

To trigger on a pulse width event:

  1. Double-tap the Trigger badge to open the Trigger configuration menu.
  2. Tap Trigger Type and select Pulse Width. See Pulse Width Trigger configuration menu.
  3. Tap Source and select the trigger source.
  4. Tap Trigger When and select the pulse width condition on which to trigger (> Limit, < Limit, = Limit, ≠ Limit, Outside Range, Inside Range).

  5. Set the pulse width time constraints:
    1. For all trigger when conditions except Outside Range or Inside Range, tap the Time Limit field and use the assigned multipurpose knob to set the pulse width time condition to meet.
    2. For Outside Range or Inside Range conditions, tap the High Time Limit and High Time Limit fields and use the assigned multipurpose knobs to set the pulse width time range condition to meet.
  6. Tap the Level field and set the threshold value at which you want to measure pulse width.
  7. Select the pulse polarity on which to trigger.

Trigger on a timeout event

Use Timeout triggering to trigger the oscilloscope when a signal stays above, stays below, or stays above or below a specified level for longer than a specified time limit.

To trigger on a timeout event:

  1. Double-tap the Trigger badge to open the Trigger configuration menu.
  2. Tap Trigger Type and select Timeout. See Timeout Trigger configuration menu.
  3. Tap Source and select the signal source.
  4. Tap Trigger When and select the condition on which to trigger (Stays High, Stays Low, or Either).

  5. Tap the Threshold field and use the assigned multipurpose knob (or double-tap the field and use the keypad to enter a value) to set the threshold value that determines when the signal is high or low.
  6. Tap the Time Limit field and use the assigned multipurpose knob (or double-tap the field and use the keypad to enter a value) to set the maximum time that a signal can stay high or low before transitioning to the opposite state.

Trigger on a runt signal event

Use Runt triggering to locate signal pulses that do not make a full logic level transition.

To trigger on a runt event:

  1. Double-tap the Trigger badge to open the Trigger configuration menu.
  2. Tap Trigger Type and select Runt. See Runt Trigger configuration menu.
  3. Tap Source and select the trigger source.
  4. Tap Trigger When and select the condition on which to trigger.
  5. Tap the Upper Threshold field and use the assigned multipurpose knob to set the threshold value that defines the upper limit that the signal must cross to be a valid signal transition (or double-tap the field and use the keypad to enter a value).
  6. Tap the Lower Threshold field and use the assigned multipurpose knob to set the threshold value that defines the lower limit that the signal must cross to be a valid signal transition (or double-tap the field and use the keypad to enter a value).
  7. If Trigger When is set to a limit value, use the Time Limit field to set the runt signal time constraints.

Trigger on a logic event

Use the Logic trigger to trigger the oscilloscope when the specified logic conditions occur on the inputs.

To trigger on a Logic event:

  1. Double-tap the Trigger badge to open the Trigger configuration menu.
  2. Tap Trigger Type and select Logic. See Logic Trigger configuration menu.
  3. Set Use Clock Edge? to enable or disable finding logic patterns that occur on the clock edge of a specified channel.
  4. Tap Logic Pattern Define Inputs and use the Logic Trigger menu to set the logic state and the signal logic threshold level for each analog or digital signal.
  5. Tap Clock Source and select the signal to use as the clock.
  6. Use the Clock Edge controls to set the signal transition edge to use to evaluate the logic condition at the clock transition.
  7. Tap the Clock Threshold field and set the threshold level that the clock signal must pass through to be considered a valid transition. The clock threshold value is independent of the input signal threshold(s).
  8. Tap Trigger When and select the waveform condition on which to trigger when not using a clock edge.

  9. Tap Define Logic and set the logic condition that must occur with all specified signals to cause a trigger event.

Trigger on a setup-hold event

Use the Setup & Hold trigger to trigger on a waveform when a data signal changes state inside of a specified setup and hold time, relative to a clock edge.

To trigger on a Setup/Hold event:

  1. Double-tap the Trigger badge to open the Trigger configuration menu.
  2. Tap Trigger Type and select Setup & Hold. See Setup and Hold Trigger configuration menu.
  3. Tap Clock Source and select the signal to use as the clock.
  4. Tap the Clock Level field and set the threshold level that the clock signal must pass through to be considered a valid transition. The clock threshold value is independent of the input signal threshold(s).
  5. Use Clock Edge to set which clock signal edge to use to start the trigger evaluation.
  6. Tap Define Inputs and use the Define Inputs menu to set the signal input sources and their threshold levels. See Setup and Hold Trigger - Define Inputs configuration menu.
  7. Tap the Setup Time field and set the length of setup time that the data signal must be stable before a clock edge occurs.
  8. Tap the Hold Time field and set the length of hold time that the data signal must be stable after a clock edge occurs.

Trigger on a rise or fall time event

Use the Rise/Fall Time trigger to trigger when the rise or fall time of a signal is less than, greater than, equal to, or not equal to a specified time limit

To trigger on a Rise/Fall event:

  1. Double-tap the Trigger badge to open the Trigger configuration menu.
  2. Tap Trigger Type and select Rise/Fall. See Rise/Fall Time Trigger configuration menu.
  3. Tap Source and select the trigger signal source.
  4. Tap Trigger When and select the condition on which to trigger.

  5. Tap the Time Limit field to set the time value for the Trigger When condition.
  6. Tap the Upper Threshold field and use the assigned multipurpose knob (or double-tap the field and use the keypad to enter a value) to set the length of setup time that the data signal must be stable before a clock edge occurs.
  7. Tap the Lower Threshold field and use the assigned multipurpose knob (or double-tap the field and use the keypad to enter a value) to set the length of hold time that the data signal must be stable after a clock edge occurs.
  8. Use the Slope controls to set the signal transition direction to detect. (rising, falling, or either direction).

Set up trigger on a parallel bus

Use this procedure to set up triggering on a parallel bus.

Use this procedure if you have already created a parallel bus.

  1. Double-tap the Trigger badge.
  2. Tap the Trigger Type field and select Bus from the list.
  3. Tap the Source field and select the parallel bus on which to trigger.
  4. Tap either the Binary or Hex Data boxes to enter the parallel bus data value, in either Binary or Hexadecimal format, on which to trigger. The number of bits shown depends on the number of sources (channels) in the parallel bus.
    1. Use multipurpose knob A to select the digit or digits to change.
    2. Use multipurpose knob B to change the value of the selected digits.

Set up trigger on a serial bus

Use this procedure to set up triggering on a serial bus.

Use this procedure if you have already created a serial bus. Serial buses require purchasing and installing serial bus options. To trigger on a Rise/Fall event:

  1. Double-tap the Trigger badge on the Settings bar.
  2. Tap Trigger Type and select Bus from the list.
  3. Tap Source and select a serial bus from the list.
  4. Tap Trigger On and select what to trigger on from the list. The displayed fields and controls depend on the bus type and Trigger On selection. Use these fields to trigger on a specific bus condition. See Bus Trigger configuration.

Set Trigger Holdoff

Trigger Holdoff sets the time, after triggering on an event, that the instrument waits before detecting the same trigger event to start the next acquisition.

Setting the correct holdoff time is important to get a stable trigger. The holdoff set for the waveform triggers on the first pulse in the burst to remedy the unstable trigger.

Prerequisite: You have set up a trigger event for a signal.

  1. Double-tap the Trigger badge on the Settings bar to open the Trigger configuration menu.
  2. Tap the Mode & Holdoff panel.
  3. To set a specific holdoff time, tap Holdoff Time and use the assigned multipurpose knob to specify a holdoff time. Or double-tap the field and use the virtual keypad to enter a holdoff time.

Trigger on an external signal using the AUX input

Use this procedure to trigger the instrument from an external signal connected to the AUX input.

  1. Double-tap the Trigger badge on the Settings bar.
  2. Tap Trigger Type and select Edge from the list.
  3. Tap Source and select Aux.
    Note:The Aux setting is available only for the Edge trigger type.
  4. Set the values for Coupling, Level, and Slope to trigger on the Aux connector signal.

    Settings take effect immediately.

Setting waveform display parameters

Use waveform display controls to set the display mode, persistence, style, and intensity display parameters, and graticule style and intensity.

Set waveform display mode (Stacked or Overlay)

Use this procedure to change the waveform display mode (Stacked or Overlay).

  1. Double-tap on an open graticule area to open the Waveform View configuration menu.
  2. Tap the Display Mode buttons to toggle between Overlay and Stacked modes.

    In stacked display mode, each waveform is stacked vertically in separate graticule slices. This is the default display mode.

    In overlay display mode, all waveforms are displayed in a single graticule (traditional waveform view).

Set the Waveform Interpolation mode

Use this procedure to set the waveform interpolation mode, which sets how waveform data points are calculated between record data points.

  1. Double-tap on an open graticule area to open the Waveform View configuration menu.
  2. Tap the buttons under Interpolation to select either Sin(x)/x or Linear.

    Sin(x)/x calculates record points along a curve between the actual acquired samples. This form of interpolation is useful when acquiring rounded waveforms such as sine waves. It is good for general-purpose uses but may introduce overshoot or undershoot in signals with fast rise times. This interpolation is also useful for looking at high-frequency signals, especially where the frequency components are just below the Nyquist frequency.

    Linear calculates record points between actual acquired samples using a straight-line fit. This interpolation is useful for measuring waveforms with fast rise times, such as pulse trains.

Set the waveform persistence, style, and intensity

Use the Waveform View configuration menu to set waveform persistence, style, and intensity.

  1. Double-tap on an open graticule area to open the Waveform View menu.
  2. Tap the Persistence field to select the persistence option.
    1. Off disables display persistence.
    2. Auto lets the oscilloscope automatically determine a persistence time for you.
    3. Infinite persistence continuously accumulates record points until you change one of the acquisition display settings. Use infinite persistence for displaying unique signal anomalies, such as glitches.
    4. Variable persistence accumulates record points for a specified time interval. Each record point decays independently according to the time interval. Use variable persistence for displaying infrequently appearing signal anomalies, such as glitches.

      If you select Variable persistence, tap Variable Persistence Time and set the time using the multipurpose knob, or double-tap the field and use the virtual keypad to enter the time value.

  3. Tap the Waveform Style buttons to set waveforms to draw as vectors (continuous lines) or dots.
    • Vectors displays the waveform with the waveform sample values connected using the selected interpolation method.
    • Dots displays the individual waveform sample values with no interpolation.
  4. Tap the Waveform Intensity field and use the multipurpose knob to set the brightness of all waveforms.

Set the graticule style and intensity

Use this procedure to set the graticule (display grid) style and intensity.

  1. Double-tap on an open graticule area to open the Waveform View configuration menu.
  2. Tap the Graticule Style field to select a graticule style from the list.
    • Grid provides a grid, cross hairs, and frame on the instrument display.
    • Time provides a vertical grid of time marks, cross hairs, and frame on the instrument display.
    • Full shows a frame and a grid on the instrument display. This style is useful for making quick, full-screen measurements with cursors and automatic readouts when cross hairs are not needed.
    • None provides a frame without a grid and cross hairs.
  3. Tap the Graticule Intensity field and use the multipurpose knob to set the brightness of all graticules.
    Note:Changing the graticule intensity also changes the intensity of vertical scale readouts and horizontal time readouts on the screen. Graticule intensity does not change the intensity of callout text on the screen.

Mask testing waveforms

Mask testing determines how well your signals conform to expected signal quality and provides instant automated statistical analysis. A mask defines a portion of the instrument display that a signal must not enter. Mask testing is supported for analog channels, analog math waveforms, analog reference waveforms, and RF vs. Time waveforms.

Create a Mask

Use the More button to create a new mask on the instrument display.

  1. Double-tap the More button and select the Mask button on the DRAW A BOX menu window. This sets the DRAW A BOX function to Mask mode.

  2. Tap outside the menu to close the DRAW A BOX menu. The Draw a Box icon is highlighted to show that it is in Mask draw mode.
  3. Tap the Draw-A-Box Zoom icon at the up right of the Results Bar to draw a rectangle on the waveform screen for the first segment to define. The segment created is associated with the channel to which it was added (in Stacked mode) or the active channel (in Overlay mode).

  4. Continue drawing rectangles to add other mask segments:
    1. If in Stacked mode, you can draw mask segments in different waveform slices.
    2. If in Overlay mode, select a channel before creating segments for that channel.
  5. When you are done drawing the mask segments, tap anywhere to end the segment draw function.
  6. To draw segments again, tap the Draw A Box zoom icon again.
  7. To change the shape of a segment, see .

Edit mask segments on the screen

Use the touchscreen or a mouse to directly edit a segment, including moving, changing size, duplicating a segment, moving individual vertices, adding and deleting vertices, and rotating the segment.

  1. To move a mask segment, touch and drag the segment to a new position.

    Note:You cannot drag a mask segment from one waveform slice to another while in Stacked display mode.
  2. To delete a mask segment:
    1. Touch and Hold or right-click on the segment to delete.
    2. Select Delete Segment from the menu.
  3. To resize a mask segment:
    1. Single-tap a segment to enable resize segment mode. Resize mode draws resize points on all four sides and the corners of a boundary area that contains the segment.

    2. Touch and drag a top, bottom, left, or right resize point to resize the segment vertically or horizontally.
    3. Touch and drag a corner resize point to resize both the length and height of the segment in the dragged direction.
      Note:You cannot move a segment while in resize mode.
    4. To exit resize mode, tap outside the mask segment. The instrument returns to normal operation.
  4. To add vertices to or delete vertices from a mask segment:
    1. Tap a segment twice to enable add/delete vertex mode. Add/delete mode draws a crosshair at each existing vertex, and a plus symbol midway between each existing vertex.

      Note:A triangular segment does not draw the existing vertices with crosshairs, as they cannot be deleted; only the midway plus symbols are shown to let you add vertices to a triangle.
    2. Tap a vertex crosshair to delete that vertex.
    3. Tap a plus symbol to add a new vertex at that location. The segment is redrawn to show the new vertex. You can continue to add vertices; there is no limit to the number of vertices in a segment.
      Note:You cannot move vertices while in add/delete vertex mode.
    4. To exit add/remove vertex mode, tap outside the mask segment. The instrument returns to normal operation.
  5. To move vertices in a mask segment:
    1. Tap the segment three times to enable move vertex mode. The move vertex mode draws crosshairs on all vertices of the segment.

    2. Touch and drag a vertex to move it to a new position.
    3. To exit move vertex mode, tap outside the mask segment. The instrument returns to normal operation.
  6. To rotate a mask segment:
    1. Tap four times in the segment to enable rotate segment mode.

    2. Touch and drag the dot in the segment to rotate it.
      Note:Once you are touching and dragging the rotate dot, you can move your finger outside of the segment to get finer control over the rotation increments.

    3. To exit rotate segment mode, tap outside the mask segment. The instrument returns to normal operation.

Edit mask segments using the Mask Definition menu

The Mask Definition menu allows you to edit the mask, including moving, changing size, moving individual vertices, adding and deleting vertices. You have the choice to edit a mask by segments or waveform tolerance with the Mask Defined By options in the Mask Settings panel.

See Mask Definition configuration menu

See Edit mask segments on the screen for information on graphically editing a segment on the screen.

CAUTION:Do not toggle between the Mask Defined By options without saving your mask settings. When Waveform Tolerances is selected, a mask generated by the Segment settings are replaced with a mask generated by the tolerance fields.

See for more information on the mask settings.

  1. To change the shape of a segment using the Mask Settings menu:
    1. Double-tap on the segment to edit.
    2. Select Segments under the Mask Defined By options.
    3. Tap the Shape field.
    4. Select the shape to which to change the segment. The segment changes shape immediately.
  2. To change the height of a segment using the Mask Settings menu:
    1. Double-tap on the segment to edit.
    2. Select Segments under the Mask Defined By options.
    3. Tap the Height field and enter the height value as units of the current vertical channel settings (volts, amps, and so on). Or double-tap on the field and use the A knob to change the value. The shape immediately changes height while maintaining the vertical center position of the segment.
  3. To change the vertical center of a segment using the Mask Settings menu:
    1. Double-tap on the segment to edit.
    2. Select Segments under the Mask Defined By options.
    3. Tap the Vertical Center field and enter the height value as units of the current vertical channel settings (volts, amps, and so on). Or double-tap on the field and use the A knob to change the value. The shape immediately changes the vertical center position of the segment.
  4. To change the width of a segment using the Mask Settings menu:
    1. Double-tap on the segment to edit.
    2. Select Segments under the Mask Defined By options.
    3. Tap the Width field and enter the width value as horizontal time (seconds). Or double-tap on the field and use the A knob to change the value. The shape immediately changes width while maintaining the horizontal center position of the segment.
  5. To change the horizontal center of a segment using the Mask Settings menu:
    1. Double-tap on the segment to edit.
    2. Select Segments under the Mask Defined By options.
    3. Tap the Horizontal Center field and enter the new horizontal center position value. Or double-tap on the field and use the A knob to change the value. The shape immediately changes the horizontal center position.
  6. To flip a segment vertically using the Mask Settings menu:
    1. Double-tap on the segment to edit.
    2. Select Segments under the Mask Defined By options.
    3. Tap the Flip Vertical button. The segment immediately flips vertically around its center position.
  7. To flip a segment horizontally using the Mask Settings menu:
    1. Double-tap on the segment to edit.
    2. Select Segments under the Mask Defined By options.
    3. Tap the Flip Horizontal button. The segment immediately flips horizontally around its center position.
  8. To rotate a segment using the Mask Settings menu:
    1. Double-tap on the segment to edit.
    2. Select Segments under the Mask Defined By options.
    3. Tap the Rotate field and use the A knob to change the value. The segment immediately rotates when you enter a value or change the value with the A knob. Or double-tap on the field and enter the number of degrees to rotate the segment, where zero (0) degrees is the position when the segment was created. You can rotate a segment from 0° to 360°.
  9. To add a point (vertex) to a segment using the Edit Vertices menu:
    1. Double-tap on the segment to edit.
    2. Select Segments under the Mask Defined By options.
    3. Tap the Edit Vertices panel.
    4. Select the vertex in the Define Area list counter-clockwise from you want to insert a new vertex. Selecting a vertex highlights that vertex on the segment.
    5. Tap Insert Point. A new vertex is added to the segment, marked with an X, and is highlighted in the list.
    6. Continue adding vertices as needed.
  10. To delete a point (vertex) from a segment using the Edit Vertices menu:
    1. Double-tap on the segment to edit.
    2. Select Segments under the Mask Defined By options.
    3. Tap the Edit Vertices panel.
    4. Select the vertex in the Define Area list that you want to delete. Selecting a vertex highlights that vertex on the segment.
    5. Tap Delete Point. A new vertex is added to the segment, marked with an X, and is highlighted in the list.
    6. Continue deleting vertices as needed.
  11. To move individual vertices in a segment using the Edit Vertices menu:
    1. Double-tap on the segment to edit.
    2. Select Segments under the Mask Defined By options.
    3. Tap the Edit Vertices panel.
    4. Select the vertex in the Define Area list that you want to move. Selecting a vertex highlights that vertex on the segment.
    5. Tap the X (time) axis or Y (Ampl.) field in the list and use the A and B knobs to change the position values. Or double-tap on each field and enter the new positional values for that vertex.
  12. To reset the shape using the Edit Vertices menu:
    1. Double-tap on the segment to edit.
    2. Select Segments under the Mask Defined By options.
    3. Tap the Edit Vertices panel.
    4. Tap Reset Points. The shape changes to a triangle centered in the display or slice.
  13. To save the segment edits:
    1. Tap the Save panel.
    2. Tap Save Mask. Only edits to the segment settings are saved.
    3. Tap outside the menu to exit.
  14. To change the vertical tolerance of a segment using the Mask Settings menu:
    1. Double-tap on the segment to edit.
    2. Select Waveform Tolerances under the Mask Defined By options.
    3. Tap the Vertical Tolerance field and enter the tolerance value as units of the current channel settings (volts, amps, and so on). Or double-tap on the field and use the A knob to change the value.
    4. Tap the Update Mask Now button to immediately change the vertical tolerance of the segment.
  15. To change the horizontal tolerance of a segment using the Mask Settings menu:
    1. Double-tap on the segment to edit.
    2. Select Waveform Tolerances under the Mask Defined By options.
    3. Tap the Horizontal Tolerance field and enter the tolerance value as units of the current channel settings (volts, amps, and so on). Or double-tap on the field and use the A knob to change the value.
    4. Tap the Update Mask Now button to immediately change the horizontal tolerance of the segment.
  16. To save the waveform tolerance edits:
    1. Tap the Save panel.
    2. Tap Save Mask. Only edits to the waveform tolerance settings are saved.
    3. Tap outside the menu to exit.

Zoom in on waveforms

Use the zoom tools to magnify waveforms to view signal details.

Turn on Zoom mode

Zoom mode lets you look at a portion of your waveform in greater detail. Enable Zoom mode and touch and drag on-screen to select the area to zoom.

To enable Zoom mode, use one of the following methods:

  1. Double-tap the More button and select the Zoom button on the DRAW A BOX menu window. This sets the Draw-a-Box function to Zoom mode.

    Tap the Draw-A-Box Zoom icon button at the up right of the Results Bar, then touch and drag in the Waveform view to draw a box on the area of interest. The Zoom mode stays enabled so that you can draw boxes to zoom in different areas of the Zoom Overview, or draw boxes to further zoom in on the same area.

  2. Tap the Zoom icon in the corner of Waveform and Plot views.

  3. Zoom overview:
    1. To use Zoom once enabled, tap the zoom icon touch and draw a box around an area of interest in the Waveform or Plot view to immediately display the zoomed waveform and the Zoom Overview window.
    2. You can draw boxes in the Waveform view, most plots, and the Zoom Overview area.
    3. The Zoom mode stays enabled so that you can draw boxes to zoom in different areas of the Zoom Overview, or draw boxes to further zoom in on the same area.
    4. Single-tapping anywhere disables the zoom box draw mode.
    5. To exit the zoom display mode, tap the Zoom icon in the corner of Waveform and Plot views.
  4. For more information on zoom:

Using Wave Inspector front-panel controls for zoom

Use the Wave Inspector controls to increase or decrease the area of the zoom box and to control the part of the waveform shown in the main Zoom view.

  1. Push the front-panel Zoom button to open Zoom mode. Push the Zoom button again to exit zoom mode.
  2. Turn the Zoom knob (center knob) to increase or decrease the horizontal area of the zoom box in the Zoom Waveform Overview, which in turn controls the amount of the waveforms shown in the main Zoom view.
  3. Turn the Pan knob (outer knob) to move the Zoom box left or right in the Zoom Waveform Overview, which in turn controls the part of the waveform shown in the main Zoom view.
  4. For information on the Zoom interface, see Zoom user interface.

Zoom mode and Searches

Use Zoom and Searches to find events of interest on a waveform.

Searches provide a way to mark a waveform event or events for reference. You can set marks automatically with search criteria such as particular edges, pulse widths, runts, logic states, rise/fall times, setup and hold, and bus data types.

You can also tap a Search badge and use its navigation buttons to position the waveform to previous or next search marks.


Search tables and Zoom mode

  • When you select a row in the Search Results Table, Zoom mode adjusts the position of the zoom window to place the selected search event in the middle of the zoom window.
  • If zoom was not already on, it is turned on with its previous zoom factor and the zoom window position adjusted to show the selected search event.

For information on creating a Search, see Add a Search.

Measurement configuration

After adding a measurement, you can customize the measurement for more precise results by using gating, setting reference levels, adding a filter, limiting the results to view, or adding a label.

To customize measurements, double-tap a Measurement badge in the Results bar to open the Measurement configuration menu overview.

Customize the following elements:
  • Label your measurement to clarify documentation.
  • Reference levels determine how time-related measurements are taken.
  • Gating confines the measurement to a certain portion of a waveform.

Label a measurement

Use this procedure to add a custom label to a measurement.

Measurement labels appear on the Measurement badge and can be added to Results tables.

Labels are set in the Measurement panel of the Measurements configuration menu. See Measurement configuration menu overview.

Prerequisite: To set measurement reference levels you must be taking a measurement. See Add a measurement.

  1. Double-tap a Measurement badge in the Results bar to open the Measurement configuration menu.
  2. Tap the Configure panel.
  3. Use one of the following methods to enter label text:
    • Tap the Label field and enter the label text using a keyboard and press the keyboard Enter key to add the label text to the Measurement badge.
    • Double-tap the Label field and enter the label text using the virtual keyboard, then tap the Enter button to add the label text to the Measurement badge. Tap outside the virtual keyboard to close it.
    Note:The new label text replaces the default measurement name on the Measurement badge that shows the measurement type (Frequency, Peak-to-Peak, and so on). To view the measurement type for a relabeled measurement, double-tap the Measurement badge and look at the topmost panel name, which has the measurement name.

    Custom measurement labels can be added to a Results table.

  4. Tap anywhere outside the Measurement menu to close it.

Set measurement reference levels

Use this procedure to set measurement reference levels.

Reference levels are set in the Reference Levels panel of the Measurements configuration menu. See Measurement configuration menu overview.

Prerequisite: To set measurement reference levels you must be taking a measurement. See Add a measurement.

Procedure

  1. Double-tap a Measurement badge. The Measurement configuration menu is displayed.
  2. Tap the Reference Levels panel.
  3. Select either Global (default) or Local:
    • Global causes changes in this panel to be updated in all other measurements that also have Global selected in this panel.

      When switching from Global to Local:

      • If a specific measurement has not been set to Local before then no changes are made to any of the values. You can update the parameters.
      • If a specific measurement has been set to Local before, then changed back to Global and then again switched to Local, the last used Local values are shown.
    • Local causes changes in this panel to only effect this measurement. When switching from Local to Global, all fields will update to the current Global parameters.
  4. Tap Set Levels In and select either % or Absolute.
    • % sets the High, Mid, and Low reference levels as percentages of the calculated Top and Base signal levels. Tap the Levels 10% - 90%, 20% - 80%, or Custom button to select the type of percent value to set.
      • 10% - 90% sets the Low, Mid and High Ref values to 10%, 50% and 90% respectively for both rising and falling edges.
      • 20% - 80% sets the Low, Mid and High Ref values to 20%, 50% and 80% respectively for both rising and falling edges.
      • Custom opens the Rising and Falling Edge numeric entry fields to set High, Mid and Low Ref levels to different values for the rising and falling edges of a waveform. Tap the Rising Edge and Falling Edge High, Mid, or Low fields and set the level using the assigned multipurpose knob. Or double-tap the field and use the virtual keypad to enter a value.
    • Absolute sets the High, Mid, and Low reference levels to specific signal levels. Tap the Levels Same or Unique buttons to select the type of absolute value to set.
      • Same sets the High, Mid, and Low reference for both rising and falling edges of a signal to the specified values. Tap the Threshold High, Mid, or Low field and set the threshold using a multipurpose knob. Or double-tap the field and use the virtual keypad to enter a value.
      • Unique opens the Rising and Falling Edge numeric entry fields to set High, Mid and Low Ref levels to different values for the rising and falling edges of a waveform. Tap the Rising Edge and Falling Edge High, Mid, or Low fields and set the level using the assigned multipurpose knob. Or double-tap the field and use the virtual keypad to enter a value.
  5. Tap the Base Top Method drop down tab and select the method from the list. This setting is only available when using the % level setting.
  6. Touch Hysteresis and use the assigned multipurpose knob to set the value.
  7. Tap anywhere outside the Measurement configuration menu to close it.

Set measurement gates

Use this procedure to specify which portion of your waveform is used to take measurements.

Gating is set in the Gating panel of the Measurements configuration menu. See Measurement configuration menu overview.

To set measurement gates you must be taking a measurement. See Add a measurement.

Procedure

  1. Double-tap a measurement badge to open the Measurement configuration menu.
  2. Tap the Gating panel.
  3. Tap Gating and select either Global or Local gating:
    • Global causes changes in this panel to be updated in all other measurements that also have Global selected in this panel.

      When switching from Global to Local:

      • If a specific measurement has not been set to Local before then no changes are made to any of the values. You can update the parameters.
      • If a specific measurement has been set to Local before, then changed back to Global and then again switched to Local, the last used Local values are shown.
    • Local causes changes in this panel to only effect this measurement. When switching from Local to Global, all fields will update to the current Global parameters.
  4. Tap the Gating Type drop down tab and select the gating type from the list:
    • None takes measurement across the entire waveform record.
    • Screen takes measurements on that portion of the waveform shown in the display. When Zoom is on, the display is the zoom window.
    • Cursors takes measurements on that portion of the waveform between the cursors. Selecting Cursors opens cursors on the measurement source. Set the cursors so that the waveform area of interest is between the cursors.
    • Logic takes measurements only when the logical state of a specified waveform is true. If Logic gating is selected, continue with the following steps.
    • Search takes measurements between the start and stop times defined by a specified search.
    • Time takes measurements between the times specified in the Start Gate Time and End Gate Time fields, relative to the trigger point.
  5. For the Logic and Search gates, tap the Source field and select the source from the list.
  6. For the Logic gate, tap the Threshold field and use the assigned multipurpose knob to set the desired threshold dividing a logic Low or High state.
  7. For the Logic gate, tap the Hysteresis field and use the assigned multipurpose knob to set the desired hysteresis.
  8. For the Logic gate, tap Active and select either the High or Low active state. High sets the gating to take measurements when the specified waveform is an active High. Low sets the gating to take measurements when the specified waveform is an active Low logic state.
  9. Tap anywhere outside the Measurement configuration menu to close it.
  10. Tap on a gating-enabled measurement badge to display the vertical gate bars on the waveform for that measurement.
  11. To return measurement gating to its default value, open the Gating panel and select a gating type of None.

Saving and recalling information

Use these procedures to save or recall waveforms, setups, or sessions.

Save a screen image

Use this procedure to save a screen image.

  1. Tap the File menu and select Save As.

    The Save As configuration menu opens.

  2. Tap Screen Capture to open the Screen Capture tab.
  3. Tap Save Location or Browse to select the location to save the file.
    1. Tap the drop down arrow in the Save Location field and select the location to save the file from a list of recent save locations. Or double-tap the field and use the virtual keyboard to enter a path to the save location.
    2. Tap Browse to open the Browse Save As Location configuration menu to navigate to and select a location at which to save the file.
  4. File Name shows the name last used to save a file. The default name is Tek000. To change the file name, double-tap the file name and enter a new file name using the virtual keyboard.
  5. Tap Auto Increment File Name to enable or disable automatic incrementing of a file name. Auto Increment File Name lets you save sequential files without needing to manually rename them each time. The count number is added to the end of the file name.
    • If Auto Increment File Name is enabled the Count defaults to 000 if there are no files at the specified location and file name that already use incremented file names. If there are files at the save location that already use the specified file name, and have already been saved using count increments, the Count field shows the next count value that will be added to the file name when the file is saved.
    • To change the starting count value, tap the Count field and use the assigned knob to change the value, or double-tap the field and use the virtual keypad to change the value.
  6. Tap Save As Type and select the desired graphic image file type from the list.
  7. Tap Save to save the screen image to the specified file name, location, and type.

Save a waveform to a file

Use this procedure to save channel waveform data to a comma-separated values (csv) or Tektronix waveform data (wfm) file, for later analysis or inclusion in reports.

  1. Tap the File menu and select Save As.

    The Save As configuration menu opens.

  2. Tap Waveform to open the Waveform tab.
  3. Tap Save Location or Browse to select the location to save the file.
    1. Tap the Save Location drop down arrow and select the location to save the file from a list of recent save locations. Or double-tap the field and use the virtual keyboard to enter a path to the save location.
    2. Tap Browse to open the Browse Save As Location configuration menu to navigate to and select a location at which to save the file.
  4. File Name shows the name last used to save a file. The default name is Tek000. To change the file name, double-tap the file name and enter a new file name using the virtual keyboard.
  5. Tap Auto Increment File Name to enable or disable automatic incrementing of a file name. Auto Increment File Name lets you save sequential files without needing to manually rename them each time. The count number is added to the end of the file name.
    • If Auto Increment File Name is enabled the Count defaults to 000 if there are no files at the specified location and file name that already use incremented file names. If there are files at the save location that already use the specified file name, and have already been saved using count increments, the Count field shows the next count value that will be added to the file name when the file is saved.
    • To change the starting count value, tap the Count field and use the assigned knob to change the value, or double-tap the field and use the virtual keypad to change the value.
  6. Tap Save As Type and select the desired waveform data type from the list.
  7. Tap Source and select the source of the waveform to save from the list. You can save a single waveform or all waveforms.
  8. Tap Save to save the waveform to the specified file name, location, and type.

Save instrument settings to a file

Use this procedure to save instrument settings to a Tektronix setup (.set) file.

  1. Tap the File menu and select Save As.

    The Save As configuration menu opens.

  2. Tap Setup to open the Setup tab.
  3. Tap Save Location or Browse to select the location to save the file.
    1. Tap the Save Location drop down arrow and select the location to save the file from a list of recent save locations. Or double-tap the field and use the virtual keyboard to enter a path to the save location.
    2. Tap Browse to open the Browse Save As Location configuration menu to navigate to and select a location at which to save the file.
  4. File Name shows the name last used to save a file. The default name is Tek000. To change the file name, double-tap the file name and enter a new file name using the virtual keyboard.
  5. Tap Auto Increment File Name to enable or disable automatic incrementing of a file name. Auto Increment File Name lets you save sequential files without needing to manually rename them each time. The count number is added to the end of the file name.
    • If Auto Increment File Name is enabled the Count defaults to 000 if there are no files at the specified location and file name that already use incremented file names. If there are files at the save location that already use the specified file name, and have already been saved using count increments, the Count field shows the next count value that will be added to the file name when the file is saved.
    • To change the starting count value, tap the Count field and use the assigned knob to change the value, or double-tap the field and use the virtual keypad to change the value.
  6. Enable Include Reference Waveforms to include waveform files for all active waveforms in the setup file.
  7. Tap Save to save the setup information to the specified file name and location.

Save reports

Use this procedure to save reports.

  1. Tap the File menu and select Save As.

    The Save As configuration menu opens.

  2. Tap Report to open the Report tab.
  3. Tap Save Location or Browse to select the location to save the file.
    1. Tap the Save Location drop down arrow and select the location to save the file from a list of recent save locations. Or double-tap the field and use the virtual keyboard to enter a path to the save location.
    2. Tap Browse to open the Browse Save As Location configuration menu to navigate to and select a location at which to save the file.
  4. File Name shows the name last used to save a file. The default name is Tek000. To change the file name, double-tap the file name and enter a new file name using the virtual keyboard.
  5. Tap Auto Increment File Name to enable or disable automatic incrementing of a file name. Auto Increment File Name lets you save sequential files without needing to manually rename them each time. The count number is added to the end of the file name.
    • If Auto Increment File Name is enabled the Count defaults to 000 if there are no files at the specified location and file name that already use incremented file names. If there are files at the save location that already use the specified file name, and have already been saved using count increments, the Count field shows the next count value that will be added to the file name when the file is saved.
    • To change the starting count value, tap the Count field and use the assigned knob to change the value, or double-tap the field and use the virtual keypad to change the value.
  6. Tap Save As Type and select the report file format from the list.
  7. Tap Append Report to enable appending this report to a previous report that uses the same file name.
  8. Double-tap Comments and use the virtual keyboard to add descriptive comments to the report.
  9. Tap Include Images and Annotations to include screen images and annotations in the report.
  10. Tap Include Setup Configuration to include the instrument settings data in the report.
  11. Tap Save to save the report file to the specified file name, location, and type.

Save sessions

Use this procedure to save a session file. A session file contains instrument setup information, measurements, reference waveforms of active signals, plots, and eye diagram masks if enabled.

  1. Tap the File menu and select Save As.

    The Save As configuration menu opens.

  2. Tap Session to open the Session tab.
  3. Tap Save Location or Browse to select the location to save the file.
    1. Tap the Save Location drop down arrow and select the location to save the file from a list of recent save locations. Or double-tap the field and use the virtual keyboard to enter a path to the save location.
    2. Tap Browse to open the Browse Save As Location configuration menu to navigate to and select a location at which to save the file.
  4. File Name shows the name last used to save a file. The default name is Tek000. To change the file name, double-tap the file name and enter a new file name using the virtual keyboard.
  5. Tap Auto Increment File Name to enable or disable automatic incrementing of a file name. Auto Increment File Name lets you save sequential files without needing to manually rename them each time. The count number is added to the end of the file name.
    • If Auto Increment File Name is enabled the Count defaults to 000 if there are no files at the specified location and file name that already use incremented file names. If there are files at the save location that already use the specified file name, and have already been saved using count increments, the Count field shows the next count value that will be added to the file name when the file is saved.
    • To change the starting count value, tap the Count field and use the assigned knob to change the value, or double-tap the field and use the virtual keypad to change the value.
  6. Tap Save to save the session data to the specified file name, location, and type.

Recall a reference waveform

Use this procedure to recall (load) and display a saved waveform as a Reference waveform. There is no set limit to the number of reference waveforms that you can load and display.

  1. Tap the Math Ref Bus >Add New Ref button on the Settings bar.

    The Recall configuration menu opens to the last location used to recall a waveform file. If the location is not available, the menu defaults to the instrument C drive.

  2. Tap Files of Type: and select the file type from the list.

    The files list updates to show all files that match the selected file type.

  3. Tap the file name in the list to add the file to the File Name field.
  4. Tap Open to exit the menu and add the reference waveform to the screen.
  5. If the file location shown in the Look In field does not contain the file to recall, navigate to the folder that contains the file to recall, using one of the following methods:
    • To recall files from recently accessed file locations, tap the drop down arrow in the Look in field and select from the list of recently accessed locations.
    • Tap in the Drive column and use the displayed contents to navigate to locations on the internal storage location C, a connected USB drive, or a network-connected drive.
    • Double-tap the Look in field and use the virtual keyboard to manually enter a path to the file location (folder).

    As you navigate the folders, the files list area shows all files that match the file type selected in the Files of Type field.

  6. Select the file to recall, using one of the following methods:
    • If the file was recently recalled, tap the drop down arrow in the File Name: field and select from a drop-down list of recently recalled files.
    • Select a file name in the main files list. The file Name field updates to show the selected file name.
      Note:You can double-tap on a file name to immediately recall the file and close the menu.
  7. Tap Recall.

    The reference waveform is loaded and displayed, and a Ref badge is added to the Settings bar.

Recall a Setup file

Use this procedure to recall (load) and configure instrument settings from a Setup file.

  1. Select File > Recall from the Menu bar to open the Recall configuration menu.
  2. Tap Setup to open the Setup tab.

    The Recall configuration menu opens to show the settings last used to recall a setup file.

  3. Tap Files of Type: and select the file type from the list.

    The files list updates to show any files that match the selected file type.

  4. Navigate to the folder that contains the file to recall, using one of the following methods:
    • To recall files from recently accessed file locations, tap the drop down arrow in the Look in field and select from the list of recently accessed locations.
    • Tap in the Drive column and use the displayed contents to navigate to locations on the internal storage location C, or on a connected USB drive.
    • Double-tap the Look in field and use the virtual keyboard to manually enter a path to the file location (folder).

    As you navigate the folders, the files list area shows all files that match the file type selected in the Files of Type field.

  5. Select the file to recall, using one of the following methods:
    • If the file was recently recalled, tap the drop down arrow in the File Name: field and select from a drop-down list of recently recalled files.
    • Select a file name in the main files list. The File Name field updates to show the selected file name.
    Note:You can double-tap on a file name to immediately recall the file and close the menu.
  6. Tap Recall.

    The instrument loads the setup file and reconfigures the oscilloscope to the setup file settings.

Recall a Session file

Use this procedure to recall (load) instrument settings and associated waveforms (as Reference waveforms) from a Session file.

  1. Select File > Recall from the Menu bar to open the Recall configuration menu.
  2. Tap Session to open the Session tab.

    The Recall configuration menu opens to show the settings last used to recall a session file.

  3. Tap Files of Type: and select the file type from the list.

    The files list updates to show any files that match the selected file type.

  4. Navigate to the folder that contains the file to recall, using one of the following methods:
    • To recall files from recently accessed file locations, tap the drop down arrow in the Look in field and select from the list of recently accessed locations.
    • Tap in the Drive column and use the displayed contents to navigate to locations on the internal storage location C, or on a connected USB drive.
    • Double-tap the Look in field and use the virtual keyboard to manually enter a path to the file location (folder).

    As you navigate the folders, the files list area shows all files that match the file type selected in the Files of Type field.

  5. Select the file to recall, using one of the following methods:
    • If the file was recently recalled, tap the drop down arrow in the File Name: field and select from a drop-down list of recently recalled files.
    • Select a file name in the main files list. The File Name field updates to show the selected file name.
      Note:You can double-tap on a file name to immediately recall the file and close the menu.
  6. Tap Recall.

    The instrument loads the session file and reconfigures the oscilloscope to the session file settings.

Menus and dialog boxes

All of the menus on your instrument and the available settings within each menu.

Act On Event configuration menu

Use this configuration menu to set the actions the instrument takes when specified conditions are met (trigger event, measurement limit failure, mask hit failure, and so on).

To open the Act On Event menu, select the Act On Event button in menus where this button is available.

Act On Event menu fields and controls

Displayed fields and controls can change depending on menu selections.

Field or control Description
Actions To Take panel
Act on Event On/Off Allows you to configure Act On Event before enabling. If the maximum number of saves is hit, this control turns off.
Event TypeSelect the event type as Discrete Events or Timer Events for saving screen capture, measurement result statistics logging, and saving waveforms.
Note:The Timer events does not work with Single/sequence. It runs for Run/Stop sequencing only.
Timer IntervalSets the time interval between two timer events. Available when Event Type is Timer Events.
CountSets number of timer events that should happen before stopping Run/Stop sequencing. Available when Event Type is Timer Events.
Save Screen Capture Saves the screen image at the time of the event, to the format designated in the Save Configuration panel.
Save Waveform Saves the waveform data at the time of the event, to the format designated in the Save Configuration panel.
Stop Acquisitions Stops the instrument from acquiring any more data.
SRQ This is a signal sent via the VISA connection to alert listeners that an event has occurred. Enabling this will send such an event when the action has occurred and if the status registers are configured correctly.
Number of Saves Allows you to toggle between Unlimited or Specify a Maximum for number of saves. Default option selected is Unlimited.
Maximum Enter the maximum number of saves in the text field. This is enabled when Number of Saves is set to Specify a Maximum.
Save Configuration panel
Save Location Choose the location of the saved files when an action triggers a save event.
Browse Browse to the save location through a visual file tree.
File Name Name the saved file. When a file is saved, the file name is followed by a time stamp.
Screen Capture Format Choose format of the screen capture save files.
Waveform Format Choose waveform format for the screen capture save files.
Source Choose the source for the waveform save files.

Actions guidelines

  • All actions are taken on a per acquisition basis. This means that if Save Screen Capture is checked in multiple columns and during a single acquisition the criteria is met in multiple columns, only a single screen capture is saved.
  • For a timer event if there is no change in waveform dataset, the active measurement does not compute and log, instead shows an * symbol next to the measurement in the selected log file.
  • The waveform save and screen capture save happens even if the waveform data is same for the two timer events.
  • If there is no change in the waveform dataset and if any measurement configuration changed in between two timer events then the measurements are computed and the measurement result statistics are added in the log file (without * symbol).

Add Measurements configuration menu overview

Use this configuration menu to select measurements you want to take on waveforms and add the measurements to the Results bar.

To open the Add Measurements configuration menu, tap the Measure button in the Analysis controls area.

The Add Measurements configuration menu always opens on the measurement tab.

To add a measurement, select the measurement type tab, select the input source or sources, select the measurement, and either tap the Add button or double-tap the measurement. The measurement is added to the Results bar.

To change individual measurement settings, double-tap the Measurement badge to open a configuration menu for that measurement. See Measurement configuration menu overview.

Add Measurements menu fields and controls

Field or control Description
Measurement tabs The tabs organize measurements by their type. The Measurement tab is the default set of Amplitude and Time measurements that are built in to the instrument.
Measurement description

(graphic and text)

Shows a graphic and short description of the selected measurement. Use this information to verify that the selected measurement is correct for what you want to measure.
Source Selects the measurement source. If the measurement requires more than one source (for example, Skew, Phase, or many Power measurements), the menu shows two source fields from which to select.
Add button Adds the selected measurement as a measurement badge to the Results bar. You can also double-tap a listed measurement to add it to the Results bar.

Measurement panels

Panel Description
Amplitude Measurements panel Tap the panel bar to list the available amplitude measurements. Touch and drag the list to scroll through all measurements. See Amplitude Measurements panel.
Time Measurements panel Tap the panel bar to list the available time measurements. Touch and drag the list to scroll through all measurements. See Time Measurements panel.

The Standard measurements tab

The tab lists the default set of amplitude and Time measurements that are included with the instrument.

To open the tab, tap the Measure button.

To add a measurement to the Results bar:
  1. Select the signal source.
  2. Tap a measurement panel:

    Amplitude Measurements panel

    Time Measurements panel

  3. Select a measurement. If a measurement requires two signal sources, select the sources in the Source 1 and Source 2 fields.
  4. Tap Add. You can also double-tap a measurement to add it immediately to the Results bar.

Amplitude Measurements panel

The Amplitude Measurements panel lists available amplitude-related measurements that you can take on analog channel signals, math waveforms (time-domain), and reference waveforms. Amplitude measurements are not available for digital signals.

To open the Amplitude Measurements panel:
  1. Tap Measure button.
  2. Tap the Amplitude Measurements panel.
To add a measurement to the Results bar:
  1. Select the signal source.
  2. Select a measurement.
  3. Tap Add. You can also double-tap a measurement to add it immediately to the Results bar.

The Amplitude Measurements panel measurements

Measurement Description
AC RMS The true Root Mean Square voltage, minus any DC component, of the waveform data points that are above the Mean signal level. You can take this measurement on each cycle in the waveform record or on the entire waveform record.
Amplitude The difference between the Top value and the Base value. You can take this measurement on each cycle in the waveform record or on the entire waveform record.
Area The area between the waveform and the Mean value, calculated by integrating the data points. The area above ground (0 V) is positive, while the area below ground is negative. You can take this measurement on each cycle in the waveform record or on the entire waveform record.
Base The most common data point value below the midpoint of the waveform, over the measurement region. Base is used as the 0% value whenever low reference values are calculated, such as in rise time or fall time measurements. You can take this measurement on each cycle in the waveform record or on the entire waveform record.
Maximum The maximum data point value. You can take this measurement on each cycle in the waveform record or across the entire waveform record.
Mean The arithmetic mean of all data points over the measurement region. You can take this measurement on each cycle in the waveform record or on the entire waveform record.
Minimum The minimum data point value. You can take this measurement on each cycle in the waveform record or on the entire waveform record.
Negative Overshoot1 The difference between the Minimum and Base values, divided by the Amplitude, and multiplied by 100 to express the measurement as a percentage of amplitude. You can take this measurement on each cycle in the waveform record or on the entire waveform record.
Peak-To-Peak The absolute difference between the Maximum and Minimum amplitudes in the measurement region. You can take this measurement on each cycle in the waveform record or on the entire waveform record.
Positive Overshoot 1 The difference between the Maximum value and the Top value, divided by the Amplitude, and multiplied by 100 to express the measurement as a percentage of amplitude. You can take this measurement on each cycle in the waveform record or on the entire waveform record.
RMS The true Root Mean Square (The square root of the mean (average) value of the squared function of the waveform data points.) You can take this measurement on each cycle in the waveform record or on the entire waveform record.
Top 1 The most common data point value above the midpoint of the waveform over the measurement region. Base is used as the 100% reference value whenever high reference values are calculated, such as in rise time or fall time measurements. You can take this measurement on each cycle in the waveform record or on the entire waveform record.

See also

Measurement configuration menu overview

1 Changing your Base Top Method in the Reference Levels panel of the Measurement configuration menu may change how this value is calculated.

Time Measurements panel

Use the Time Measurements panel to add timing-related measurements to the Results bar. Time measurements can be taken on time-domain analog, math, and reference waveforms. Timing measurements can also be taken on some digital channel signals.

To open the Time Measurements panel:
  1. Tap Measure button.
  2. Tap the Time Measurements panel.
To add a measurement to the Results bar:
  1. Select the signal source.
  2. Select a measurement. If a measurement requires two signal sources, select the sources in the Source 1 and Source 2 fields.
  3. Tap Add. You can also double-tap a measurement to add it immediately to the Results bar.

Time Measurements panel

Measurement Description
Burst Width The duration of a series of adjacent crossings of the Mid reference level. Bursts are separated by a specified idle time.

The measurement is taken on each burst in a waveform record.

Data Rate Data Rate is the reciprocal of Unit Interval.

The measurement is taken on each bit of the waveform record.

Delay The time difference between the mid reference (default 50%) amplitude point of two different waveforms. You can specify the signal edges to measure in the measurement’s Configuration menu.

The measurement requires two sources.

Duration N-Periods The time required to complete N cycles. A cycle is the time between two adjacent (same direction) crossings of the mid reference level.

The measurement is taken on each cycle in the waveform record.

Fall Time The time required for the trailing edge of the first pulse in the measurement region to fall from the high reference value (default = 90%) to the low reference value (default = 10%).

The measurement is taken on each cycle of the waveform record.

Falling Slew Rate The rate of change (in volts/second) as an edge transitions from a high reference level to a low reference level.

The measurement is taken on each cycle of the record in the measurement region.

Frequency The frequency of the waveform. Frequency is the reciprocal of Period (Frequency = 1/Period).
High Time The time the signal remains above the Top reference level.

The measurement is taken on each cycle in the waveform record.

Hold Time The time between the specified Mid reference level crossing on the clock signal to the closest Mid reference level crossing on the specified data signal.

The measurement is taken on each specified clock edge in the waveform record.

Low Time The time the signal remains below the Base reference level.

The measurement is taken on each cycle in the waveform record.

Negative Duty Cycle The ratio of the negative pulse width to the signal period, expressed as a percentage.

The duty cycle is measured on the first cycle in the measurement region.

Negative Pulse Width The distance (time) between the mid reference (default 50%) amplitude points of a negative pulse.

The measurement is taken on each cycle in the waveform record or measurement region.

Period The time between two adjacent crossings of the Mid reference level (one cycle) of the waveform.

The measurement is taken on each cycle of the waveform record or measurement region.

Phase The time difference (phase shift) between the specified signal edges of waveform source 1 and waveform source 2. The measurement is expressed in degrees, where 360° comprise one waveform cycle. This measurement requires two sources.

The measurement is taken on each cycle of the waveform record.

Positive Duty Cycle The ratio of the positive pulse width to the signal period, expressed as a percentage.

The duty cycle is measured on the first cycle in the measurement region.

Positive Pulse Width The distance (time) between the mid reference (default 50%) amplitude points of a positive pulse.

The measurement is made on the first pulse in the measurement region.

Rise Time The time required for the leading edge of the first pulse in the measurement region to rise from the low reference value (default = 10%) to the high reference value (default = 90%).

The measurement is taken on each cycle of the waveform record.

Rising Slew Rate The rate of change (in volts/second) as an edge transitions from a low reference level to a high reference level.

The measurement is taken on each cycle of the record in the measurement region.

Setup Time The time between the specified Mid reference level crossing on the data signal to the closest Mid reference level crossing on the specified clock signal.

The measurement is made on each specified clock edge in the waveform record.

Skew The time between the specified Mid reference level crossing on one source to the closest Mid reference level crossing on the second source signal.

The measurement is made on each cycle in the waveform record.

Time Outside Level The time the specified signal remains above the Top reference level and/or below the Base reference level.

The measurement is made on each occurrence in the waveform record.

Time to MinTime to Min is the amount of time from the trigger point to the minimum data point. This measurement can be made across the entire record or on each cycle in the record.
Time to MaxTime to Max is the amount of time from the trigger point to the maximum data point. This measurement can be made across the entire record or on each cycle in the record.
Unit Interval The time difference between two successive bits.

The measurement is taken on each bit of the waveform record.

See also

Measurement configuration menu overview

The FRA tab

The FRA tab lists the optional FRA-related measurement that you can add to the Results bar.

Note:The FRA tab opens if the 2-SOURCE or the 2-ULTIMATE license options is installed.
To open the FRA measurement tab:
  1. Tap the Measure button.
  2. Tap the FRA tab.
To add a measurement to the Results bar:
  1. Select the signal sources. If the measurement requires two signal sources, select the sources in the Source 1 and Source 2 fields.
  2. Select the Control Loop Response (Bode) measurement.
  3. Tap Add. You can also double-tap a measurement to add it to the Results bar.

Frequency Response Analysis (FRA) Measurement panel

Measurement Description
Control Loop Response (Bode) Plots the gain as 20 log (Vout/Vin) and phase difference between Vin and Vout at each frequency within the swept band. The resulting plot is commonly referred to as a Bode Plot.

Control Loop Response (Bode) measurement configuration panel

Double-tap a Power measurement badge to open the Control Loop Response (Bode) measurement configuration menu. Use this menu to set the measurements source, add a custom name (label) for the measurement and other parameters.

Field or control Description
Input Source Selects the channel connected to the input side of the DUT. Tap the field to show the list of available input sources.
Output Source Selects the channel connected to the output side of the DUT. Tap the field to show the list of available output sources.
Label Sets the name of the measurement. You can use the default name, or double-tap in the field and change the label using a connected keyboard or the virtual keyboard.
Generator Sets the signal source to Internal or External and generates stimulas as a series of sine waves with configured amplitude. The sine waves are sent to the input of the DUT.

The AFG31000 Series and AFG3000 Series are the supported external signal source.

Connection When Generator is set to External, Connection opens the AFG configuration menu. Enter the IP address and tap Test Connection to connect to the signal generator.
Impedance A user configurable Impedance for the generator. Sets the impedance as 50 Ω or High Z.
Points Per Decade Sets the number of frequency points between the start and stop frequency in terms of log scale.

The minimum and default value is 10 frequency points. The maximum value is 100.

Start Frequency Sets the generator start frequency. The default start frequency is 100 Hz. The minimum value of start frequency is 10 Hz. Double-tap in the field and change the start frequency using a connected keyboard or the virtual keyboard.
Stop FrequencySets the generator stop frequency. The default stop frequency is 20 MHz. The maximum stop frequency depends on the generator. The maximum stop frequecy is 50 MHz or internal generator. Double-tap in the field and change the stop frequency using a connected keyboard or the virtual keyboard.
Amplitude Mode Sets the built-in signal generator output amplitude mode.

Constant Sets the constant amplitude for all frequencies in the internal signal generator.

Profile Opens a configuration menu to set the amplitude for each frequency band.

The generator uses the amplitude values to set the output amplitude as the frequency changes. Refer Sample amplitude values for a DC-DC convertor DUT table for amplitude values.

Configure Profile Opens the Profile configuration menu to enter the frequency range with amplitude values. See Configure Profile.

Available when Amplitude Mode is Profile.

Results TableOpens and displays the FRA Results Table which contains the measurement result.
Amplitude Sets the generator to apply the same amplitude to all frequencies output from the generator.

The minimum value is 20 mV for the internal generator. Refer Sample amplitude values for a DC-DC convertor DUT table for amplitude values. The default value is 100 mV.

Available when Amplitude Mode is Constant.

PresetConfigures the generator, so the oscilloscope is ready to acquire the desired waveform once the measurement starts.

Sets the built-in generator such as start frequency, impedance, and amplitude values. It also sets the vertical and horizontal acquisition parameters, so that oscilloscope is ready to acquire the desired waveform once the measurement starts.

Note: Math sources are not supported for Control Loop Response (Bode) measurement.

Right click menu on the Power badge

The following menu is available when you right click on the power badge.

ControlsDescription
Configure Power 1Opens the Control Loop Response (Bode) measurement configuration menu.
Delete Power 1Deletes the selected power measurement badge.

Configure Profile

Use the Configure Profile menu to configure the amplitude profile for the Control Loop Response (Bode) measurement.

It is recommended to customize the internal signal generator amplitude values using the amplitude profile configuration. Profiling allows you to set the generator to a lower amplitudes, at different frequencies where the DUT is sensitive, and set the higher amplitudes where the DUT is less sensitive to distortion. A Switched-mode Power Supply (SMPS) is very sensitive near the zero degree cross over frequency, so it is advisable to define a profile, instead of using a constant amplitude output signal.

The following table list the available configurations.

Field or control Description
Start Displays the start frequency.
Stop Displays the stop frequency.
Amplitude Shows the amplitude value used to set the AFG level.
Insert Step Inserts an additional row displaying start, stop, and amplitude values.
Delete Step Deletes the selected row.
Clear Table Clears all the values in the table.

Use the following steps to configure the amplitude profile for a Control Loop Response (Bode) measurement:

  1. Tap Configure Profile button. The configure profile dialog is displayed. The configure profile dialog displays two rows:
    • The start frequency in the first row is the start frequency from the Control Loop Response (Bode) measurement configuration panel.
    • The stop frequency in the first row is the mean of start and stop frequency values from the Control Loop Response (Bode) measurement configuration panel.
    • The start frequency in the second row is the same stop frequency value in the first row from the table of configure profile. This applies to all the following rows added in the table of configure profile.
    • The stop frequency in the second row is the stop frequency from the Control Loop Response (Bode) measurement configuration panel.
  2. Edit the values as necessary to reduce the variations in the gain curve at particular frequencies where the DUT is sensitive to distortion. Adjust by making configuration changes and viewing the response in the gain/phase curve of the Control Loop Response (Bode) plot.
  3. Tap outside the configure profile table save your updates.

Sample amplitude values for a DC-DC convertor DUT

Start Stop Amplitude
10 Hz 100 Hz 1 V
100 Hz 500 Hz 800 mV
500 Hz 1 kHz 600 mV
1 kHz 10 kHz 400 mV
10 kHz 100 kHz 350 mV
100 kHz 1 MHz 300 mV
1 MHz 10 MHz 250 mV
10 MHz 20 MHz 200 mV
Note:The maximum stop frequency value for the internal signal generator is 50 MHz.

Connect to an external signal generator

Use the Generator Connection Information menu to connect to a signal generator. This option is available only when the generator configuration is set to External.

Field or control Description
IP address Enter the IP address of the instrument.
Test Connection Click to test the connection with the instrument.

Connection setup for Frequency Response Analysis (FRA) measurements

Figure 1. Connection diagram for Control Loop Response (Bode) measurement


To perform Bode measurement, inject stimulus signal from AFG over a band of frequencies to the control loop feedback path of the power converter. To facilitate the signal injection, a small resistor needs to be inserted in the feedback loop. The injection resistor value should be of <10 Ω (recommanded value is around 5 Ω).

Measurement configuration menu overview

Use this configuration menu to add statistics to a measurement badge readout and change measurement settings including source, scope (global or local), reference levels, gating, and pass/fail testing.

To open a Measurement configuration menu for a measurement, double-tap a Measurement badge in the Results bar. The configuration menu and panels only show fields and controls relevant to the selected measurement.

The menu opens on the measurement name panel (the name of the measurement), which provides controls to display additional statistics to the measurement badge. The content of the measurement name panel depends on the measurement. The most common Measurement Name fields are listed in the following table.

Measurement configuration menu fields, controls, and panels

Field, control, or panel Description
Measurement Statistics

(Measurement name panel)

A list of measurement statistics related to the measurement. You can add these statistics to a measurement badge by selecting the Show Statistics in Badge control.
Show Statistics in Badge

(Measurement name panel)

Adds the listed statistical measurement readouts to the measurement badge readout.
Results TableButton that opens the Measurement Results of the measurement. The results table displays all the statistics of the measurement. To add a results table to the screen, double-tap the measurement badge and tap Results Table.

See Add Results Table configuration menu.

Configure panel Sets the source, label text, and other fields that are specific to each measurement type.

See Configure panel (Measurement configuration menu).

Reference Levels panel Sets the reference levels and units used to take measurements, the scope of the reference level settings (global or local), and the method used to calculate the Top and Base waveform values.

See Reference Levels panel (Measurement configuration menu).

Gating panel Sets the measurement region (gate) used to take measurements. Select the scope of the gate setting (global or local), and the type of gating to use.

See Gating panel (Measurement configuration menu).

Pass/Fail Testing panel Sets the conditions for pass/fail testing for measurements and sets actions to take when a measurement fails.

See Pass/Fail Testing panel (Measurement Settings menu).

Measurement Name panel (Measurement configuration menu)

The Measurement Name panel (the name of the measurement) provides controls for adding display statistics to the measurement badge and opening Results Table of the measurement.

To open the measurement name panel, double-tap a Measurement badge. This is the default panel shown when you open a Measurement settings menu.

The content of the Measurement Name panel depends on the measurement.

Field or control Description
Measurement Statistics A list of measurement statistics. You can add these statistics to a measurement badge by selecting the Show Statistics in Badge control.
Show Statistics in Badge Select to add the listed statistical measurement readouts to the measurement badge.
Results TableAdds the Measurement Results of the measurement to the screen. The results table displays all the statistics of the measurement.

See also

Configure panel (Measurement configuration menu)

Reference Levels panel (Measurement configuration menu)

Gating panel (Measurement configuration menu)

Pass/Fail Testing panel (Measurement Settings menu)

Configure panel (Measurement configuration menu)

Use the Configure panel to set the measurement source(s), add a custom name (label) for the measurement, and other parameters.

To open the Configure panel:
  1. Double-tap a Measurement badge to open the Measurement configuration menu.
  2. Tap the Configure panel.

Not all items listed are shown for all measurements; The panel only shows fields and controls relevant to the selected measurement.

Field or control Description
Source Sets the signal source used to take the measurement. Tap the field to show the list of available sources. If the measurement requires more than one source, multiple Source fields are displayed.
Label Sets the name of the measurement. You can use the default name, or double-tap in the field and change the label using a connected keyboard or the virtual keyboard.
Signal Type Sets the signal type (Clock, Data, Auto) of the source signal for some measurements.
Source 1 Sets the Source 1 for the measurement where two sources are required. Available for Delay, Phase, and Skew measurement.
Source 2 Sets the Source 2 for the measurement where two sources are required. Available for Delay, Phase, and Skew measurement.
Edge, Clock edge Sets the edge of the signal to use for starting the measurement.
From Edge Sets the Source 1 waveform edge on which to start the measurement, for two-source measurements.
To Edge Sets the Source 2 waveform edge on which to stop the measurement, for two-source measurements.
Calculate One Measurement Per Sets the amount of waveform data to use to calculate one measurement; one measurement across the entire waveform record or one measurement for each cycle of the waveform in the record.

Other measurement panels

Measurement Name panel (Measurement configuration menu)

Reference Levels panel (Measurement configuration menu)

Gating panel (Measurement configuration menu)

Pass/Fail Testing panel (Measurement Settings menu)

Reference Levels panel (Measurement configuration menu)

Use the Reference Levels panel to set the scope of the reference level settings (global or local), the reference levels (High, Mid, and Low), the units used to take measurements, and the method used to calculate the Top and Base waveform values. You can set the levels to be the same or different for rising and falling edges.

To open the Reference Levels panel:
  1. Double-tap a Measurement badge.
  2. Tap the Reference Levels panel.

Reference Levels panel- fields and controls

Not all items listed in the table are shown for all measurements; The panel only shows fields and controls relevant to the selected measurement.
Field or control Description
Reference Levels Global sets whether the reference levels defined in this measurement apply to all measurements that are set to global (the default setting).

Local sets the Reference Level parameters to apply to just this measurement.

Source Lists the source signals used for each edge of the measurement.
Set Levels In Sets the method used to set or calculate the High, Mid, and Low reference levels. Select % or Units and use the Multipurpose Knob to set custom reference values.
Levels Sets the reference levels as specified percentages of the Top and Base waveform measurement.

To set custom reference values, tap Custom, tap a setting field, and use the Multipurpose Knob to set the different % (relative) or absolute values.

High and Low references are used to calculate rise and fall times. The default High reference is 90% and Low reference is 10%.

Mid reference is primarily used for measurements between edges such as pulse widths. The default level is 50%.

Base Top Method Sets the method to calculate the waveform Base and Top values, which is then used to calculate the High, Mid, and Low reference levels.

Auto is the default method, and automatically determines the best Base Top method to use. Most commonly sets the Top Base method to Histogram Mode.

MinMax Uses the minimum and maximum values in the waveform record to determine the base and top amplitude. Useful on a waveform with low noise and free from excessive overshoot.

Histogram Mean uses histogram analysis to calculate the mean or average value using all values above and below the waveform midpoint. Top is set to the mean high value, and Base is set to the mean low value.

Histogram Mode uses histogram analysis to calculate the most common values above and below the waveform midpoint. Top is set to the common high value, and Base is set to the common low value.

Hysteresis Sets the threshold margin to the reference level which the signal must cross to be recognized as changing; the margin is the relative reference level plus or minus half the hysteresis. Use hysteresis to filter out spurious events. Tap the field and use the Multipurpose Knob to change the value.

Other measurement settings panels

Measurement Name panel (Measurement configuration menu)

Configure panel (Measurement configuration menu)

Gating panel (Measurement configuration menu)

Pass/Fail Testing panel (Measurement Settings menu)

Gating panel (Measurement configuration menu)

Use Gating to confine a measurement to a certain part of a waveform.

To open the Gating panel:
  1. Double-tap a Measurement badge in the Results bar to open the Measurement configuration menu.
  2. Tap the Gating panel.

Gating panel, fields and controls

Not all items listed in the table are shown for all measurements; The panel shows fields and controls relevant to the selected measurement.
Field or control Description
Gating Sets whether this measurement's gating settings are Global or Local.

When Global is selected, changing anything in this panel causes the same change to all other measurements that also have Global selected.

When Local is selected, settings in this panel only effect this measurement.

Gating Type Sets the gate type used to take measurements.

None: Measurements are taken across the entire record.

Screen: Measurements are taken on the portion of the waveform shown on the display. When zoom is on, the ‘display’ on which to measure is the zoom window.

Cursors: Measurements are taken on the portion of the waveform between the cursors.

Logic: Measurements are taken only when the logical state of a specified waveform is true.

Search: Measurements are taken between the start and stop times defined by a specified search.

Time: Measurements are taken between the times specified in the Start Gate Time and End Gate Time fields, relative to the trigger point (0 s).

Source Sets the signal source to use for Logic or Search gates.

If Gating Type is Logic, the Source field lists all available sources.

If Gating Type is Search, the Source field lists all available searches.

Threshold Sets the threshold value for the Logic gate source to be considered a logic 1 value. Available when Source is Logic.
Hysteresis Sets the Hysteresis value for the Logic gate source. Available when Source is Logic.
Active Sets the logic state value for the Logic gate source. Available when Source is Logic.
Start Gate Time

End Gate Time

Sets the starting time (Start Gate) and ending time (End Gate) between which to take a measurement. The starting and ending gate times are relative to the trigger time (0 s). Available when Gating Type is Time.

Guidelines

  • Only one gated region is allowed per measurement. You can create duplicate measurements and define different gates for each one.
  • Tap on a gating-enabled measurement badge to display the vertical gate bars on the waveform for that measurement.
  • Gating is indicated by two vertical bars; one at the start of the gated region and one at the end.
  • If the measurement has more than one source, gate bars are drawn on both sources.
  • Time gates can be placed anywhere. They can precede acquisition start value and extend beyond the acquisition value.
  • The Time Gating bars are shown in both the overview and zoomed view when zoom is on.

See also

Measurement Name panel (Measurement configuration menu)

Configure panel (Measurement configuration menu)

Reference Levels panel (Measurement configuration menu)

Pass/Fail Testing panel (Measurement Settings menu)

Pass/Fail Testing panel (Measurement Settings menu)

Use these settings to test measurement values against a specified limit and set actions for the instrument to take on failure.

To open the PASS/FAIL TESTING panel:
  1. Double-tap a Measurement badge.
  2. Tap the Pass/Fail Testing panel.

Pass/Fail Testing panel fields and controls

Not all items listed in the table may be shown for all measurements; The panel only shows fields and controls relevant to the selected measurement.

Field or control Description
Pass/Fail Test Turns pass/fail testing on or off. Default is off.
Fail When Sets the condition for when the test on the measurement will fail. Default is < Limit.
Limit Sets the measurement limit value. This control is present when Fail When is not set to Inside Range or Outside Range.
Low Limit Sets the low limit for the measurement value. This control is only present when Fail When is set to Inside Range or Outside Range.
High Limit Sets the high limit for the measurement value. This control is only present when Fail When is set to Inside Range or Outside Range.
Actions on Failure Opens a configuration menu to set the actions the instrument takes when the test fails.

See Act On Event configuration menu.

Badge Navigation Sets the navigation in the results badge.

Tap to toggle to view Failures or All Occurrences.

When Failure is selected the navigation buttons move from failure to failure.

When All Occurrences is selected, the navigation button moves through each occurrence.

Other measurement settings panels

Measurement Name panel (Measurement configuration menu)

Configure panel (Measurement configuration menu)

Reference Levels panel (Measurement configuration menu)

Gating panel (Measurement configuration menu)

Add Plot configuration menu

Use this configuration menu to select and plot the amplitude and time relationship of two (XY) signals, which can be sourced from channel, math, or reference waveforms.

To add a plot:
  1. Double-tap Horizontal badge on the Setting bar.
  2. Tap the Acquisition Settings panel.
  3. Tap XY to On. The plot is added to the screen.

Closing a plot view

To close (delete) a Plot view, tap the X in the upper right corner of the view.

Deleting the Measurement badge that enabled the plot also closes the plot.

Add Results Table configuration menu

Use this configuration menu to add a table of all active measurements, searches, or bus decode values. Results tables show values in a spreadsheet-like format.

To add a Measurement result table to the screen:
  1. Double-tap a measurement badge.
  2. Set the Results Table to On. The Measurement result table is added to the screen.
To add a Bus Decode Results table to the screen:
  1. Double-tap a bus badge.
  2. Set the Results Table to On. The Bus Decode Results table is added to the screen.
To add a Search Results table to the screen:
  1. Double-tap a Search badge.
  2. Set the Results Table to On. The Search Results table is added to the screen.

Results Tables operations overview

Results tables list summaries of all active measurements, bus decode activity, and search results in a spreadsheet format. Use Results tables to quickly compare values or save the results to a report.

Results Table - general operations

  • Double-tap anywhere on a results table to open its configuration menu.
  • To scroll up and down in a results table, tap the table and use Multipurpose knob A to scroll and select table rows.
  • To move a column, touch and drag the column title to a new position in the table.
  • To add or remove a column from the table, double-tap the results table to open the table configuration menu and select from available columns to add or remove.
  • To resize a column width, use the mouse to position the cursor on the column name border to change, then click and drag the column border to resize that column.
  • To configure or delete a single measurement in a Measurement Results table, touch and hold on a table row to open a right-click menu that lets you configure or delete that measurement.
  • You cannot sort the contents of a column.

See also

Measurement Table configuration menu

Bus Decode Results table configuration menu

Search Results table menu

Frequency Response Analysis (FRA) Results table configuration menu

To open the FRA Results Table, double-tap the Power badge and set the Results Table to On.

To open the FRA Results Table configuration menu, double-tap anywhere in the FRA Results table.

Custom Results Table configuration menu

Field or control Description
Table Settings panel
Column Visibility Select or clear individual check boxes to add or remove that column from the table.
Save panel
Save Table Opens a menu to save the Custom Results Table data to a comma-separated value (CSV) file. See Save As configuration menu, Custom Results Table.

Save As configuration menu, Custom Results Table

Use this configuration menu to set the location and file name to save the Custom Results Table content as a comma-separated value (CSV) file.

To open the Save As configuration menu to save a Custom Results Table
  1. Double-tap anywhere in the Custom Results Table to open the Custom Results Table configuration menu.
  2. Tap the Save panel.
  3. Tap the Save Table button.

Save As configuration menu, Custom Results Table

Field or control Description
Save Location Sets the location to save the file. The default value is the previous save location.

Tap on the file path and enter the location. Use an external keyboard or double-tap on the file name to open the virtual keyboard and enter the path details.

You can also use the Browse button to open a menu to navigate to and select the save location.

Tap the down arrow icon on the right end of the field to open the list of recently saved file locations for the current save type. Up to 20 recently saved file locations are stored.

Browse Tap to open the Browse Save As Location dialog, to navigate to and select the location to save the file. See Browse Save As Location configuration menu.
File Name Enter the file name. The default file name is Tek000. The file name increments on the next save (Tek001, Tek002, and so on).

Double-tap on the file name to open the virtual keyboard or use an external keyboard to enter the name.

Save as Type You can only save a Custom Results Table to a comma-separated value (CSV) file.

Measurement Table configuration menu

Use this menu to select which statistics to show in the Measurement Results table, select the number of digits to show in each column, save a table, and so on.

To open the Measurement Table configuration menu, double-tap anywhere in a Measurement Results table.

Measurement Table menu

Field or control Description
Column Visibility panel
Label Adds a Label column to show the user-defined label for all measurements. If no user-defined label exists, the column shows the default measurement name.
Peak-to-Peak Adds a Peak-to-Peak column and shows a Pk-Pk readout for all relevant measurements.
Check boxes to select columns to display Select or clear individual statistic check boxes to add or remove that column from the table.
Column Resolution panel
Measurement column resolution Sets the resolution (number of digits to display) in each measurement column.
Set to Defaults Sets all columns to show 5 digit readout resolution.
Other panel
Statistics Sets the amount of statistical information you want to display for each measurement.

Both shows both the accumulated results and the current acquisition results.

All Acquisitions shows statistics for all acquisitions from the last action that cleared acquisition memory.

Current Acquisition shows the statistics for just the current acquisition.

Show Cycle-to-Cycle Variation For measurements where this applies, this function allows you to see the mean or average variation between measurements performed on each available cycle in the waveform.
Row Height Optimized For Sets the row height of the Measurement results table as per your preference for Mouse or Touch.
Save Table Opens a menu with which to save the results table data to a file. See Save As configuration menu (Measurement Results Table).

Measurements Results Table operations

  • Double-tap anywhere on a results table to open its configuration menu.
  • To configure or delete a single measurement in a Measurement Results table, touch and hold on a table row to open a right-click menu that lets you configure or delete that measurement.
  • If you add or delete a measurement to the Results bar, that measurement is automatically added to or deleted from an existing Measurement Results table.
  • To scroll up and down in a results table, tap the table and use Multipurpose knob A to scroll and select table rows.
  • To move a column, touch and drag the column title to a new position in the table.
  • To add or remove a column from the table, double-tap the results table to open the table configuration menu and select from available columns to add or remove.
  • To resize a column width, use the mouse to position the cursor on the column name border to change, then click and drag the column border to resize that column.
  • You cannot sort the contents of a column.

Save As configuration menu (Measurement Results Table)

Use the Save As configuration menu to set the location and file name to which to save the contents of a results table, as a comma-separated value (csv) format file.

To open the Save As configuration menu to save a results table to a file:
  1. Double-tap anywhere in the Measurement Results table to open the Measurement Table configuration menu.
  2. Tap the Other panel.
  3. Tap Save Table.

Save As menu, Measurement Results table fields and controls

Field or control Description
Save Location Sets the location to which to save the file. The default value is the last location to which a file was saved.

Tap on the file path and use a keyboard to enter a new save location. Or double-tap on the file name to open the on-screen keyboard and enter a path.

Tap the down arrow icon on the right end of the field to open a list of recent file save locations, for the current save type, up to a maximum of 20 locations.

Browse Tap to open the Browse Save As Location dialog, to navigate to and select the location to which to save the file. See Browse Save As Location configuration menu.
File Name The file name assigned to the file. The default file name is Tek000. The file name increments on the next save (Tek001, Tek002, and so on).

Tap on the file name and use a keyboard to enter a new file name. Or double-tap on the file name to open the on-screen keyboard and enter a file name.

Save as Type You can save only table results as comma separated values (.csv) files.

Search Results table menu

Use this menu to configure the content of the Search results table.

To open the Search Results Table configuration menu, double-tap anywhere in the Search Results table. If there are multiple search results tables, tap the tab of the search table to configure and then double-tap anywhere in that table.

Search Results Table menu

Field or control Description
Table Settings
Location Timestamp Resolution Sets the search mark timestamp resolution to display. The timestamp shows the time of each mark relative to the first acquired search mark.

Short shows a rounded version of the timestamp data.

Note:The actual timestamp data is not truncated by the Short setting, and is retained in the acquisition data.

Precise displays the full timestamp value by individual time units (seconds, milliseconds, microseconds, and so on).

Delta resolution Sets the timestamp resolution to display for mark deltas. Delta shows the time difference between each search mark.

Short shows the delta time between marks as a rounded version of the timestamp data.

Note:The actual timestamp data is not truncated by the Short setting, and is retained in the acquisition data.

Precise displays the full delta timestamp value by individual time units (seconds, milliseconds, microseconds, and so on).

Save Table Opens a menu with which to save the results table data to a file. See Save As configuration menu (Measurement Results Table).
Column Visibility panel
Check boxes to select columns to display Select or clear individual check boxes to add or remove that column from the table.

Search Results Table operations

  • If there are multiple searches, each search has a tab in the table. Tap the tab of the search to display and/or configure, and then double-tap anywhere in that table to open the configuration menu for that table.
  • Double-tap anywhere on a results table to open its configuration menu.
  • If you add or delete a search to the Results bar, that search is automatically added to or deleted from an existing Search Results table.
  • To scroll up and down in a results table, tap the table and use Multipurpose knob A to scroll and select table rows.
  • To move a column, touch and drag the column title to a new position in the table.
  • To add or remove a column from the table, double-tap the results table to open the table configuration menu and select from available columns to add or remove.
  • To resize a column width, use the mouse to position the cursor on the column name border to change, then click and drag the column border to resize that column. If the column width change forces the truncation of data, hovering over a cell displays the full information content of that cell (subject to significant digits limitations on numeric entries).
  • You cannot sort the contents of a column.
  • You cannot change the order of rows.
  • After the search events are displayed in the table, select any row and the waveform zoom points to the respective event in the display. Vice versa, when you move the zoom window, the corresponding row will be selected in the table.

Save As configuration menu (Search Results table)

Use this configuration menu to set the location and file name to which to save the contents of a results table, as a comma-separated value (csv) format file.

  1. Double-tap anywhere in the Search Results table to open the Search Results configuration menu.
  2. Tap the Save Table.

Save As menu, Search Results table fields and controls

Field or control Description
Save Location Sets the location to which to save the file. The default value is the last location to which a file was saved.

Tap on the file path and use a keyboard to enter a new save location. Or double-tap on the file name to open the on-screen keyboard and enter a path.

Tap the down arrow icon on the right end of the field to open a list of recent file save locations, for the current save type, up to a maximum of 20 locations.

Browse Tap to open the Browse Save As Location dialog, to navigate to and select the location to which to save the file. See Browse Save As Location configuration menu.
File Name The file name assigned to the file. The default file name is Tek000. The file name increments on the next save (Tek001, Tek002, and so on).

Tap on the file name and use a keyboard to enter a new file name. Or double-tap on the file name to open the on-screen keyboard and enter a file name.

Save as Type You can save only table results as comma separated values (.csv) files.

Bus Decode Results table configuration menu

Use this configuration menu to select which information to show in each Bus Decode Results table, or save a Bus Decode Results table to a file.

To open the Bus Decode Table configuration menu, double-tap anywhere in the Bus Decode Results table.

If there are multiple bus decode results tables, each bus has a tab in the table. Tap the tab of the bus to display and/or configure, and then double-tap anywhere in that table to open the configuration menu for that table.

Bus Decode Results table menu

Field or control Description
Column Visibility panel
Check boxes for columns in table to display Select or clear individual check boxes to add or remove that column from the table. The listed columns depend on the selected bus table in the Bus Decode Results table. Select the tab of the bus, at the top of the table, to which you want to make changes, then double-tap the table to open the configuration menu for that table.
Other panel
Save Table Opens the Save As dialog to let you save the table data to a comma-separated values (.csv) file. See Save As configuration menu (Bus Decode Results table).

Bus Decode Results Table operations

  • Each bus in a Bus Decode Results table has its own tab. Tap a tab to show the results for that bus.
  • Selecting a Bus in the Bus Decode Table configuration menu does not select and display the tab for that bus. Select a tab before configuring the table for that tab.
  • Double-tap anywhere on a results table to open the configuration menu for that tab.
  • If you add or delete a bus to the Settings bar, that bus is automatically added to or deleted from an existing Bus Decode Results table.
  • To scroll up and down in a results table, tap the table and use Multipurpose knob A to scroll and select table rows.
  • To move a column, touch and drag the column title to a new position in the table.
  • To add or remove a column from the table, double-tap the results table to open the table configuration menu and select from available columns to add or remove.
  • To resize a column width, use the mouse to position the cursor on the column name border to change, then click and drag the column border to resize that column.
  • You cannot sort the contents of a column.

Save As configuration menu (Bus Decode Results table)

Use this configuration menu to set the location and file name to which to save the contents of a results table, as a comma-separated value (csv) format file.

To open the Save As configuration menu:
  1. Double-tap anywhere in the Bus Decode Results table to open the Bus Decode Results configuration menu.
  2. Tap the Other panel.
  3. Tap Save Table.

Save As menu (Bus Decode Results table) fields and controls

Field or control Description
Save Location Sets the location to which to save the file. The default value is the last location to which a file of this type was saved.

Tap on the file path and use a keyboard to enter a new save location. Or double-tap on the file name to open the on-screen keyboard and enter a path.

Tap the down arrow icon on the right end of the field to open a list of recent file save locations, for the current save type, up to a maximum of 20 locations.

Browse Tap to open the Browse Save As Location configuration menu, to navigate to and select the location to which to save the file. See Browse Save As Location configuration menu.
File Name The file name assigned to the file. The default value is either the user-entered name used to last save this file type, or a default name created by the instrument if this file type has not previously been saved with a custom file name. The default file name uses the format Tek000.

Tap on the file name and use a keyboard to enter a new file name. Or double-tap on the file name to open the virtual keyboard and enter a file name.

Save as Type You can only save table results as comma separated values (.csv) files.

Bus configuration menu

Use the Bus menu to select the bus type to display, configure the input sources, and set how to display the bus on the screen.

To open the Bus configuration menu:
  • For an existing bus, double-tap the Bus badge in the Settings bar.
  • To add a new Bus badge on the Settings bar, tap the Math Ref Bus > Add New Bus button. This adds the Bus badge to the Settings bar and opens the Bus configuration menu.

Bus configuration menu - fields and controls

Field or control Description
Display Toggles bus display On or Off.
Label Enter label text in this field. The default label is the name of the bus type.
Position Sets the vertical position of the bus waveform. Default is 0 (center of graticule).
Set to 0 Sets the vertical position of the bus waveform to 0 (center graticule).
Results TableSets the results table as On or Off to see the active measurements, bus decode activity, and search results in a spreadsheet format. Default is off.
Bus Type Select a bus from the drop down list. The Parallel bus type comes standard on the instrument. Serial buses require purchase and installation of serial bus triggering and analysis options.
Source configuration A set of fields and controls that set the bus signal input parameters. Shown fields depend on the selected bus type. See the individual bus configuration help topics for information on their settings.
Display format Enables showing just the decoded bus or both the bus and its digital waveforms. You can also tap on the + symbol on the bus waveform to toggle between showing the bus only or showing bus and source waveforms.
Decode format Sets how decoded data information is shown in the bus. Select from listed formats. Available formats depend on the bus type.

Bus type configuration menus

Use the following links to access information on specific Bus configuration menus.

CAN serial bus configuration menu

I2C serial bus configuration menu

LIN serial bus configuration menu

NFC serial bus configuration menu

Parallel Bus configuration menu

RS232 serial bus menu

SENT serial bus configuration menu

SPI serial bus configuration menu

Parallel Bus configuration menu

Use this menu to set up and display a parallel bus waveform. Parallel bus decoding and triggering is included with the oscilloscope.

To set up the parallel bus:
  • To create a new parallel bus, tap the Math Ref Bus > Add New Bus button on the Settings bar. Open the bus configuration menu by double clicking on the badge. Set the Bus Type to Parallel.
  • To change the settings on an existing parallel bus waveform, double-tap the Bus waveform badge to open the configuration menu, and make necessary changes.

Parallel bus configuration menu fields and controls

Field or control Description
Display Turns On or Off displaying the bus on the Waveform view.
Label Enter a label for the bus. The default label is the selected bus type.

To enter label text, double-tap the field and enter label using the virtual keyboard, or tap the field and enter text from an attached keyboard.

Position Sets the vertical position of the bus waveform. The default position is vertically centered in a slice (in Stacked mode), or center screen in Overlay mode. The unit of position is screen divisions.
Set to 0 Sets the vertical position to 0 divisions (centered vertically in a slice or on the screen).
Results TableSets the results table as On or Off to see the active measurements, bus decode activity, and search results in a spreadsheet format. Default is off.
Bus Type Set to Parallel to define a parallel bus.
Clocked Data Toggles Yes or No to use a clock signal to recover the data bits from the bus inputs.
Clock Source Sets the source for the bus clock signal. The source can be an analog or digital channel.

Available when Clocked Data is set to Yes.

Polarity Sets the clock signal edge to use for timing reference.

Available when Clocked Data is set to Yes.

Threshold Sets the threshold value to determine high logic value.

Available when Clocked Data is set to Yes.

Define Inputs Opens a Parallel Bus - Define Inputs configuration menu to set the signal sources and the bit order (MSB to LSB) for the bus. See Parallel Bus - Define Inputs menu.
Display Format Sets the waveform view to show just the decoded bus information, or the decoded bus plus the source signal waveforms.
Decode Format Sets the decode format used to display the bus information. Formats are Hex and Binary.

Other bus types

Other serial bus types are available as purchasable options. Once purchased and installed, the new bus types are shown in the Bus Type menu. The serial bus options also add corresponding bus trigger capabilities (when supported) to the Trigger menu. See the Bus configuration menu for links to all serial bus configuration menus.

See also

Bus Trigger configuration

Bus Search configuration menus

Parallel bus search configuration menu

Parallel Bus - Define Inputs menu

Use this menu to select the signal sources and order for the parallel bus waveform

To access the Parallel Bus - Define Inputs menu, double-tap a Parallel Bus badge to open the configuration menu, and tap the Define Inputs button.

Parallel Bus - Define Inputs menu fields and controls

Field or control Description
Parallel bus definition list Lists the signal source and thresholds of selected channels or waveforms. The MSB is at the top of the list.

To add a signal to the Parallel bus definition list, tap a source button in the Sources list. The button moves from the Sources list to the bottom of the bus list.

Use the arrow buttons to the right of the field to move a selected signal up or down in the list.

To remove a signal from the Parallel bus (and return it to the Sources list), tap on the signal source button.

To change the threshold value for individual channels, tap in a selected Threshold field and use the assigned multipurpose knob, or double-tap the field to open the keypad and enter values.

Sources Lists all available sources to use for a parallel bus. To add a source to the Parallel bus definition list, tap a source button. The button moves from the Sources list to the bottom of the bus list.
Set All Thresholds Sets all thresholds in the Parallel bus definition list to the specified value. Enter a value and tap Apply to set the values.

Other bus types

Serial bus decode and analysis features are available as purchasable options. Once purchased and installed, the new bus types are shown in the Bus Type menu. The serial bus options also add corresponding bus trigger capabilities (when supported) to the Trigger menu. See the Bus configuration menu for links to all serial bus configuration menus.

See also

Bus Trigger configuration

Bus Search configuration menus

Parallel bus search configuration menu

I2C serial bus configuration menu

Use the I2C bus menu to set up and display an I2C (Inter-Integrated Circuit) serial bus waveform.

To set up the I2C serial bus menu:
  • To create a new I2C bus waveform, tap the Math Ref Bus > Add New Bus button on the Settings bar. Open the bus configuration menu by double clicking on the badge. Set the Bus Type to I2C.
  • To change the settings on an existing I2C serial bus waveform, double-tap the I2C Bus waveform badge and make necessary changes in the configuration menu.

I2C serial bus menu fields and controls

Field or control Description
Display Turns On or Off displaying the bus on the Waveform view.
Label Enter a label for the bus. The default label is the selected bus type.

To enter label text, double-tap the field and enter label using the virtual keyboard, or tap the field and enter text from an attached keyboard.

Position Sets the vertical position of the bus waveform. The default position is vertically centered in a slice (in Stacked mode), or center screen in Overlay mode. The unit of position is screen divisions.
Set to 0 Sets the vertical position to 0 divisions (centered vertically in a slice or on the screen.
Results TableSets the results table as On or Off to see the active measurements, bus decode activity, and search results in a spreadsheet format. Default is Off.
Bus Type Set to I2C.
SCLK Input Sets the source and threshold level for the Serial Clock Line signal.
SDA Input Sets the source and threshold level for the Serial Data signal.
Include R/W bit in Address Select Yes to display 7-bit addresses as eight bits, where the eighth bit (LSB) is the R/W bit, or display 10-bit addresses as 11 bits, where the third bit is the R/W bit.

Select No to display 7-bit addresses as seven bits, and 10-bit addresses as ten bits.

Display Format Sets the waveform view to show just the decoded bus information, or the decoded bus plus the source signal waveforms.
Decode Format Sets the decode format used to display the bus information. Formats are Hex and Binary.

Other bus types

Other serial bus types are available as purchasable options. Once purchased and installed, the new bus types are shown in the Bus Type menu. The serial bus options also add corresponding bus trigger capabilities (when supported) to the Trigger menu. See the Bus configuration menu for links to all serial bus configuration menus.

See also

Bus Trigger configuration

Bus Search configuration menus

I2C serial bus search configuration menu

SPI serial bus configuration menu

Use the SPI bus menu to set up and display an SPI (Serial Peripheral Interface) synchronous serial bus waveform.

To set up the SPI serial bus:
  1. To create a new SPI bus waveform, tap the Math Ref Bus > Add New Bus button on the Settings bar. Open the bus configuration menu by double clicking on the badge. Set the Bus Type to SPI.
  2. To change the settings on an existing SPI serial bus waveform, double-tap the Bus waveform badge to open the configuration menu, and make necessary changes.

SPI serial bus menu fields and controls

Field or control Description
Display Turns On or Off displaying the bus on the Waveform view.
Label Enter a label for the bus. The default label is the selected bus type.

To enter label text, double-tap the field and enter label using the virtual keyboard, or tap the field and enter text from an attached keyboard.

Position Sets the vertical position of the bus waveform. The default position is vertically centered in a slice (in Stacked mode), or center screen in Overlay mode. The unit of position is screen divisions.
Set to 0 Sets the vertical position to 0 divisions (centered vertically in a slice or on the screen.
Results TableSets the results table as On or Off to see the active measurements, bus decode activity, and search results in a spreadsheet format. Default is off.
Bus Type Set to SPI.
Data Inputs Select the number of inputs as One or Two.

One enables to configure one data input. Two enables to configure MOSI and MISO.

Framing Set to Slave Select (SS) or Idle framing modes.
SCLK Input Select the channel source and threshold level for the Serial Clock signal (output from master).

Set the Polarity to rising or falling edge of the clock signal used by the master device to start transferring bits.

Available when Framing is SS and Data Inputs is One, and Framing is Idle.

SS Input Select the channel source and threshold level for the Slave Select signal to start communications with the slave device.

Set the Polarity to use Active High or Active Low logic for the SS signal.

Available when Framing is SS.

Data Input Select the channel source and threshold level for the data input.

Set the Polarity to use Active High or Active Low for the SS signal.

Available when Data Inputs is One.

MOSI Input Select the channel source and threshold level for the MOSI (Master In Slave Input) input.

Set the Polarity to use Active High or Active Low logic for the MOSI signal.

Available when Data Inputs = Two, and Framing = SS/Idle.

MISO Input Select the channel source and threshold level for the MISO (Master In Slave Output) input.

Set the Polarity to use Active High or Active Low logic for the MISO signal.

Available when Framing is SS/Idle and Data Inputs is Two.

Word Size Enter the word size, in bits. Minimum is 4, maximum is 32, and default is 8.
Bit Order Set to most significant bit MS First or least significant bit LS First.
Idle Time (Framing = ) Set the idle frame time.

Available when Framing is Idle.

Display Format Sets the waveform view to show just the decoded bus information, or the decoded bus plus the source signal waveforms. This depends on data input.

Available only when Data Input is One.

Decode Format Sets the decode format used to display the bus information. Formats are Hex and Binary.

Other bus types

Other serial bus types are available as purchasable options. Once purchased and installed, the new bus types are shown in the Bus Type menu. The serial bus options also add corresponding bus trigger capabilities (when supported) to the Trigger menu. See the Bus configuration menu for links to all serial bus configuration menus.

See also

Bus Trigger configuration

Bus Search configuration menus

SPI serial bus search configuration menu

RS232 serial bus menu

Use this menu to set up and display an RS232 serial bus waveform.

To set up a RS232 serial bus:

  1. To create a new RS232 bus waveform, tap the Math Ref Bus > Add New Bus button on the Settings bar. Open the bus configuration menu by double clicking on the badge. Set the Bus Type to RS232.
  2. To change the settings on an existing RS232 serial bus waveform, double-tap the RS232 Bus waveform badge to open the configuration menu and make necessary changes.

RS232 serial bus menu fields and controls

Field or control Description
Display Turns On or Off displaying the bus on the Waveform view.
Label Enter a label for the bus. The default label is the selected bus type.

To enter label text, double-tap the field and enter label using the virtual keyboard, or tap the field and enter text from an attached keyboard.

Position Sets the vertical position of the bus waveform. The default position is vertically centered in a slice (in Stacked mode), or center screen in Overlay mode. The unit of position is screen divisions.
Set to 0 Sets the vertical position to 0 divisions (centered vertically in a slice or on the screen.
Results TableSets the results table as On or Off to see the active measurements, bus decode activity, and search results in a spreadsheet format. Default is Off.
Bus Type Set to RS232.
Data Inputs Set the data input as One or Two.
Bit Rate Sets the data bit rate.

To enter a custom bit rate, select Custom and enter the custom bit rate in the Custom Rate input box.

Data Bits Set the number of bits that define a data packet for your RS232 bus.
Source Set the signal source from available analog or digital channels. Available when Data inputs is One.
Threshold Set the threshold level to define a logic high level. Available when Data inputs is One.
Tx Source, RX SourceSet the transmitter and receiver signal source from available analog channels. Available when Data inputs is Two.
Tx Threshold, Rx ThresholdSet the transmitter and receiver threshold level to define a logic high level. Available when Data inputs is Two.
Polarity Select the polarity to match the RS232 bus being acquired. Use Normal polarity for RS-232 signals, and Inverted polarity for RS-422, RS-485, and UART buses.
Parity Set the parity to match the RS232 bus being acquired.
Packet View Set to On to show decoded packet level information on the bus waveform.
End of packet select the appropriate end of packet value to match the RS232 bus being acquired.

Available when Packet View is On.

Display Format Sets the waveform view to show just the decoded bus information, or the decoded bus plus the source signal waveforms.
Decode Format Sets the decode format used to display the bus information. Formats are Hex, Binary, and ASCII.

Other bus types

Other serial bus types are available as purchasable options. Once purchased and installed, the new bus types are shown in the Bus Type menu. The serial bus options also add corresponding bus trigger capabilities (when supported) to the Trigger menu. See the Bus configuration menu for links to all serial bus configuration menus.

See also

Bus Trigger configuration

Bus Search configuration menus

RS-232 serial bus search configuration menu

CAN serial bus configuration menu

Use the CAN bus menu to set up and display a CAN (Controller Area Network) or CAN FD (CAN Flexible Datarate) serial bus waveform.

  • To create a new CAN bus waveform:
    1. Tap Math Ref Bus > Add New Bus on the Settings bar.
    2. Double-tap the CAN badge to open the bus configuration menu.
    3. Set the Bus Type to CAN.
  • To change the settings on an existing CAN serial bus waveform, double-tap the CAN waveform badge on the Settings bar to open the configuration menu.

CAN serial bus menu fields and controls

Field or control Description
Display Turns on or off displaying the bus on the Waveform view.
Label Enter a label for the bus. The default label is the selected bus type.

To enter label text, double-tap the field and enter label using the virtual keyboard, or tap the field and enter text from an attached keyboard.

Position Sets the vertical position of the bus waveform. The default position is vertically centered in a slice (in Stacked mode), or center screen in Overlay mode. The unit of position is screen divisions.
Set to 0 Sets the vertical position to 0 divisions (centered vertically in a slice or on the screen).
Results TableSets the results table as On or Off to see the active measurements, bus decode activity, and search results in a spreadsheet format. Default is off.
Bus Type Set to CAN to set up and display a CAN bus waveform.
Signal Type Sets the CAN signal type to decode. The default is CAN_H.
CAN Standard Sets the CAN signal standard to decode. The default is CAN 2.0.
Source Select the signal source from listed analog and digital channels.
Threshold Sets the high/low logic transition level.
Sample Point Sets the sample point from 5% to 95% of the position within the bit period or the unit interval.
Bit Rate Sets the bit rate of your CAN bus serial data.

To enter a custom bit rate, select Custom and enter the custom bit rate in the Custom Rate input box.

Available when CAN Standard is CAN 2.0.

SD Bit Rate Sets the SD bit rate of your CAN FD serial bus data.

To enter a custom bit rate, select Custom and enter the custom bit rate in the Custom Rate input box.

Available when CAN Standard is CAN FD (ISO) or CAN FD (non-ISO).

FD Bit Rate Sets the FD bit rate of your CAN FD serial bus data.

To enter a custom bit rate, select Custom and enter the custom bit rate in the Custom Rate input box.

Available when CAN Standard is CAN FD (ISO) or CAN FD (non-ISO).

Nominal Bit Rate<description>

To enter a custom bit rate, select Custom and enter the custom bit rate in the Custom Rate input box.

Available when CAN Standard is CAN XL.

XL Bit Rate<description>

To enter a custom bit rate, select Custom and enter the custom bit rate in the Custom Rate input box.

Available when CAN Standard is CAN XL.

Custom rate Sets the custom bit rate to use to decode the signal. Tap the field and use the Multipurpose knob to change the value, or double-tap on the field and use the virtual keypad to enter a custom bit rate.

Available when Bit Rate or SDI Bit Rate is Custom.

Display Format Bus sets the Waveform view to show just the decoded bus information.

Bus and Waveform sets the Waveform view to show both the decoded bus and the source signal waveforms.

You can also tap on the + symbol on the bus waveform to toggle between showing the bus only or showing bus and source waveforms.

Decode Format Sets the decode format used to display the bus information. Formats are Hex, Binary, Mixed Hex, and Symbolic.

Selecting Symbolic lets you navigate to and load a dbc decode label file for the current CAN waveform. The .dbc file is a proprietary description of a CAN bus system and its message and signal labels. Loading the .dbc file displays the message and signal information on the decoded CAN waveform. Selecting a .dbc file immediately loads the .dbc contents into the instrument.

Note:.dbc files are not saved as part of a save session operation.

To remove the .dbc symbolic information from the waveform, select a different Decode Format.

Browse Opens the standard File Open dialog to navigate to and load a .dbc file to apply to the bus being created. You can navigate to TekDrive to load .dbc file. The File Open dialog automatically filters for the .dbc file extension.

Available when Decode Format is Symbolic.

Path field Use to enter the path to a .dbc file, or select from a drop-down list of recently accessed .dbc files.

Available when Decode Format is Symbolic.

Other bus types

Other serial bus types are available as purchasable options. Once purchased and installed, the new bus types are shown in the Bus Type menu. The serial bus options also add corresponding bus trigger capabilities (when supported) to the Trigger menu. See the Bus configuration menu for links to all serial bus configuration menus.

See also

Bus Trigger configuration

Bus Search configuration menus

CAN serial bus search configuration menu (when not using a .dbc symbol definition file)

LIN serial bus configuration menu

Use this menu to set up and display a LIN (Local Interconnect Network) serial bus waveform.

To set up the LIN serial bus:

  • To create a new LIN bus waveform, tap the Math Ref Bus > Add New Bus button on the Settings bar. Open the bus configuration menu by double clicking on the badge. Set the Bus Type to LIN.
  • To change the settings on an existing LIN serial bus waveform, double-tap the LIN Bus waveform badge and make necessary changes.

LIN serial bus menu fields and controls

Field or control Description
Display Turns On or Off displaying the bus on the Waveform view.
Label Enter a label for the bus. The default label is the selected bus type.

To enter label text, double-tap the field and enter label using the virtual keyboard, or tap the field and enter text from an attached keyboard.

Position Sets the vertical position of the bus waveform. The default position is vertically centered in a slice (in Stacked mode), or center screen in Overlay mode. The unit of position is screen divisions.
Set to 0 Sets the vertical position to 0 divisions (centered vertically in a slice or on the screen.
Results TableSets the results table as On or Off to see the active measurements, bus decode activity, and search results in a spreadsheet format. Default is off.
Bus Type Set to LIN.
Source Set the signal source from available analog or digital channels.
Threshold Set the threshold level to define a logic high level.
Polarity Select the polarity to match the LIN bus being acquired.
LIN Standard Select the standard to match the LIN bus being acquired.
Bit rate Sets the bit rate.

To enter a custom bit rate, tap Custom and enter the custom bit rate in the Custom Rate input box.

Include Parity Bits with ID Set to Yes to include parity bits with the ID.
Sample Point Sets the sample point from 5% to 95% of the position within the bit period or the unit interval.
Display Format Sets the waveform view to show just the decoded bus information, or the decoded bus plus the source signal waveforms.
Decode Format Sets the decode format used to display the bus information. Formats are Hex, Binary, and Mixed.

Other bus types

Other serial bus types are available as purchasable options. Once purchased and installed, the new bus types are shown in the Bus Type menu. The serial bus options also add corresponding bus trigger capabilities (when supported) to the Trigger menu. See the Bus configuration menu for links to all serial bus configuration menus.

See also

Bus Trigger configuration

Bus Search configuration menus

LIN serial bus search configuration menu

SENT serial bus configuration menu

Use the SENT bus menu to set up and display a SENT (Single Edge Nibble Transmission) serial bus waveform.

  • To add a new SENT bus waveform
    1. Tap Math Ref Bus > Add New Bus on the Settings bar.
    2. Double-tap the new bus badge to open the bus configuration menu.
    3. Set the Bus Type to SENT.
    4. Use the menu fields and controls to configure the SENT bus parameters.
  • Double-tap the Bus waveform badge to change the settings on an existing SENT serial bus waveform.

SENT serial bus menu fields and controls

Field or control Description
Display Turns On or Off displaying the bus in the Waveform view.
Label Enter a label for the bus. The default label is the selected bus type.

To enter label text, double-tap the field and enter label using virtual keyboard, or tap the field and enter text from an attached keyboard.

Position Sets the vertical position of the bus waveform. The default position is vertically centered in a slice (in Stacked mode), or center screen in Overlay mode. The unit of position is screen divisions.
Set to 0 Sets the vertical position to 0 divisions (centered vertically in a slice or on the screen).
Results TableSets the results table as On or Off to see the active measurements, bus decode activity, and search results in a spreadsheet format. Default is off.
Bus Type Set to SENT to set up and display a SENT serial bus waveform.
Source Select the signal source from the listed analog and digital channels.
Threshold Sets the high/low logic transition level.
Polarity Sets the signal edge to use to determine the width of the clock tick pulse.

Normal (default) corresponds to a falling edge polarity that determines how many ticks wide a pulse is.

Inverted corresponds to a rising edge polarity.

Clock Tick Sets the time period of the clock tick. The valid range is from 1 µs to 300 µs. The default is 3 µs.
Tick Tolerance Sets the tolerance, as a percent, that is acceptable for the clock tick signal to be recognized. The valid tolerance range is from 1% to 30%. The default tolerance is 20%.
Fast Data Channels Sets the number of fast data channels. The default is 2.
Data Nibbles Sets the number of data nibbles to detect in the serial signal (3, 4, or 6).

Available when Fast Data Channels is 1.

Channel Widths (C1/C2) Sets the number of bits per channel when using two fast data channels (12/12, 14/10, or 16/8).

Available when Fast Data Channels is 2.

Pause Pulse Sets the instrument to detect a Pause pulse in the serial data. The default value is Yes.
Slow Channel Sets the slow channel characteristics. Tap and select from the available list of slow channel types. The default value is None.
Display Format Sets the display format for waveforms as Bus or Bus and Waveform.

Bus sets the waveform view to display just the decoded bus information.

Bus and Waveform sets the waveform view to display both the decoded bus and the source signal waveforms.

You can also tap on the + symbol on the bus waveform to toggle between showing the bus only or showing bus and source waveforms.

Decode Format Sets the decode format used to display the bus information. Formats are Hex, Binary, Mixed Decimal, and Mixed Hex.

Other bus types

Other serial bus types are available as purchasable options. Once purchased and installed, the new bus types are shown in the Bus Type menu. The serial bus options also add corresponding bus trigger capabilities (when supported) to the Trigger menu. See the Bus configuration menu for links to all serial bus configuration menus.

See also

Bus Trigger configuration

Bus Search configuration menus

SENT serial bus search configuration menu

Search configuration menu overview

Use the Search configuration menu to define conditions that you want to mark on a channel or waveform signal.

To open the Search configuration menu, double-tap a Search badge in the results bar.

If there are no Search badges on the Results bar, tap the Search button. A Search badge is added to the Settings bar, and the Search configuration menu opens to search type of Edge (default).

The search types and settings are similar to their corresponding trigger types (Edge, Pulse Width, Runt, and so on).

You can create multiple searches for the same waveform. Each occurrence of the search condition is marked with a triangle along the top of the waveform. Marks for each search are shown in a different color.

Use the following links to access information on specific Search settings.

Other search types

Bus Search configuration menus

Edge Search configuration menu

Logic search configuration menu

Pulse Width Search configuration menu

Rise/Fall Time Search configuration menu

Runt Search configuration menu

Setup and Hold Search configuration menu

Timeout Search configuration menu

Bus Search configuration menus

Use a Bus search to search for and mark bus-related events (Start, Stop, Missing Acq, Address, Data, and so on) on a bus waveform.

To create a new Bus search:
  1. Tap Search.
  2. Set the Search Type to Bus.
  3. Select the bus Source.
  4. Use the search menu fields to set the search parameters.

To change the settings of an existing search, double-tap the search badge to open its configuration menu and make necessary changes.

Select a link to view the configuration menu settings for a specific bus.

CAN serial bus search configuration menu (when not using a .dbc symbol definition file)

I2C serial bus search configuration menu

LIN serial bus search configuration menu

NFC serial bus search configuration menu

Parallel bus search configuration menu

RS-232 serial bus search configuration menu

SENT serial bus search configuration menu

SPI serial bus search configuration menu

Other search types

Edge Search configuration menu

Logic search configuration menu

Pulse Width Search configuration menu

Rise/Fall Time Search configuration menu

Runt Search configuration menu

Setup and Hold Search configuration menu

Timeout Search configuration menu

Parallel bus search configuration menu

Use the Parallel Search configuration menu to define conditions to search for and mark on an Parallel bus waveform. You can have multiple searches on the same bus.

Note:Parallel bus search is standard on all instruments.
Field or control Description
Display Enables or disables displaying search marks on this search.
Act on Event Tap the Act on Event button to configure the actions the instrument must take when a search event occurs. See Act On Event configuration menu for the available fields and controls.
Results TableSets the results table as On or Off to see the active measurements, bus decode activity, and search results in a spreadsheet format. Default is off.
Search Type Set to Bus.
Source Select the parallel bus that you want to search.
Data Sets the data pattern for which to search. The number of bits shown depends on how the parallel bus is defined.

Tap the Binary or Hex field and use the A and B knobs to select and change the values. Or double-tap on the field and use the virtual keypad to enter values.

A, B knob controls Use the A knob to select (highlight) the digit(s) to change.

Use the B knob to change the value of the digit(s).

Copy Trigger Settings to Search Sets the search criteria to match the current oscilloscope trigger settings.
Copy Search Settings to Trigger Sets the current oscilloscope trigger settings to match the search criteria.

See also

Bus Trigger configuration

Bus Search configuration menus

Parallel Bus configuration menu

I2C serial bus search configuration menu

Use the I2C Search configuration menu to define conditions to search for and mark on an I2C bus waveform. You can have multiple searches on the same bus.

Field or control Description
Display Enables or disables displaying search marks on this search.
Act on Event Tap the Act on Event button to configure the actions the instrument must take when a search event occurs. See Act On Event configuration menu for the available fields and controls.
Results TableSets the results table as On or Off to see the active measurements, bus decode activity, and search results in a spreadsheet format. Default is Off.
Search Type Set to Bus.
Source Select the I2C bus that you want to search.
Mark On Select the type of information for which to search.
Direction Sets the transfer direction for which to search.

Available when Mark On is Address or Address & Data.

Addressing Mode Sets the slave device address length (7 bits or 10 bits long).

Available when Mark On is Address or Address & Data.

Address Sets the address pattern for which to search. The number of bits shown depends on the Address Mode setting.

Tap the Binary or Hex field and use the A and B knobs to select and change the values. Or double-tap on the field and use the virtual keypad to enter values.

Available when Mark On is Address or Address & Data.

Data Bytes Sets the number of data bytes for which to search (one to five bytes). Use the A knob to change the value.

Available when Mark On is Data or Address & Data.

Data Sets the data pattern for which to search. The number of bits shown depends on the Data Bytes setting.

Tap the Binary or Hex field and use the A and B knobs to select and change the values. Or double-tap on the field and use the virtual keypad to enter values.

Available when Mark On is Data or Address & Data.

A, B knob controls Use the A knob to select (highlight) the character to change.

Use the B knob to change the value of the character.

Copy Trigger Settings to Search Sets the search criteria to match the current oscilloscope trigger settings.
Copy Search Settings to Trigger Sets the current oscilloscope trigger settings to match the search criteria.

See also

Bus Trigger configuration

Bus Search configuration menus

I2C serial bus configuration menu

SPI serial bus search configuration menu

Use the SPI Search configuration menu to define conditions to search for and mark on an SPI bus waveform. You can have multiple searches on the same bus.

Field or control Description
Display Enables or disables displaying search marks on this search.
Act on Event Tap the Act on Event button to configure the actions the instrument must take when a search event occurs. See Act On Event configuration menu for the available fields and controls.
Results TableSets the results table as On or Off to see the active measurements, bus decode activity, and search results in a spreadsheet format. Default is off.
Search Type Set to Bus.
Source Select the SPI bus that you want to search.
Mark On Select the type of information for which to search.
Search Source Set the search source. Set either MOSI or MISO.

Available when Mark On is SS Active.

Data Words Sets the number of data words defined based on the word size in bus configuration. If the word size in bus configuration is 4, then data words will go to 32.

Maximum data words is word size <=128.

Available when Mark On is Data.

Data Sets the data pattern for which to search. The number of bits shown depends on the Data Words setting.

Tap the Binary or Hex field and use the A and B knobs to select and change the values. Or double-tap on the field and use the virtual keypad to enter values.

Available when Mark On is Data.

A, B knob controls Use the A knob to select (highlight) the digit(s) to change.

Use the B knob to change the value of the digit(s).

Copy Trigger Settings to Search Sets the search criteria to match the current oscilloscope trigger settings.
Copy Search Settings to Trigger Sets the current oscilloscope trigger settings to match the search criteria.

See also

Bus Trigger configuration

Bus Search configuration menus

SPI serial bus configuration menu

RS-232 serial bus search configuration menu

Use the RS-232 Search configuration menu to define conditions to search for and mark on an RS-232 bus waveform. You can have multiple searches on the same bus.

Field or control Description
Display Enables or disables displaying search marks on this search.
Act on Event Tap the Act on Event button to configure the actions the instrument must take when a search event occurs. See Act On Event configuration menu for the available fields and controls.
Results TableSets the results table as On or Off to see the active measurements, bus decode activity, and search results in a spreadsheet format. Default is off.
Search Type Set to Bus.
Source Select the RS232 bus that you want to search.
Mark On Select the type of information for which to search.
Data Bytes Sets the number of data bytes (1 byte = 8 bits) for which to search (one to ten bytes). Use the A knob to change the value.

Available when Mark On is Data.

Data Sets the data pattern for which to search. The number of bits shown depends on the Data Words setting.

Tap the Binary or Hex field and use the A and B knobs to select and change the values. Or double-tap on the field and use the virtual keypad to enter values.

Available when Mark On is Data.

A, B knob controls Use the A knob to select (highlight) the digit(s) to change.

Use the B knob to change the value of the digit(s).

Copy Trigger Settings to Search Sets the search criteria to match the current oscilloscope trigger settings.
Copy Search Settings to Trigger Sets the current oscilloscope trigger settings to match the search criteria.

See also

Bus Trigger configuration

Bus Search configuration menus

RS232 serial bus menu

CAN serial bus search configuration menu (when not using a .dbc symbol definition file)

Use the CAN Search configuration menu to define conditions to search for and mark on an CAN bus waveform. This menu supports searches for CAN bus events when a .dbc symbol definition file is not loaded.

Note:See CAN serial bus search configuration menu (when using a .dbc symbol definition file) for CAN serial bus searches that use a loaded .dbc symbol definition file.
Field or control Description
Display Enables or disables displaying waveform search marks on this search.
Act on Event

Tap the Act on Event button to configure the actions the instrument must take when a search event occurs. See Act On Event configuration menu for the available fields and controls.

Results TableSets the results table as On or Off to see the active measurements, bus decode activity, and search results in a spreadsheet format. Default is off.
Search Type Set to Bus.
Source Select the CAN bus that you want to search.
Mark On Sets the type of information for which to search and mark on the bus waveform acquisition.

Start of Frame puts a search mark at each occurrence of a CAN frame start.

Type of Frame puts a search mark at each occurrence of the frame type as set in the Frame Type field.

Identifier puts a search mark at each occurrence of a CAN identifier frame as set in the Direction, Identifier Format, and Identifier fields. Not available when the bus badge Decode Format is set to Symbolic.

Data puts a search mark at the occurrence of the specified data fields (Data Bytes, Data Offset, Mark When, and Data). Not available when the bus badge Decode Format is set to Symbolic.

Id & Data puts a search mark at each occurrence of the specified Id and data fields. Not available when the bus badge Decode Format is set to Symbolic.

End of Frame puts a search mark at each occurrence of a CAN frame end.

Error puts a search mark at each occurrence of the specified error condition (Missing Ack, Bit Stuffing, FD Form Error, or Any Error).

Frame Type Sets the frame type for which to search and mark on the bus waveform (Data Frame, Remote Frame, Error Frame, Overload Frame).

Available only when Mark On is Type of Frame.

Direction Sets the Identifier's transfer direction (Read, Write, or Either) for which to search.

Available only when Mark On is Identifier.

Identifier Format Sets the CAN identifier format bit length for which to search (Standard 11-bit, or Extended 29-bit for CAN 2.0B).

Available only when Mark On is Identifier or ID & Data.

Identifier Sets the identifier pattern for which to search. The number of bits shown depends on the Identifier Format setting.

Tap the Binary or Hex field and use the A and B knobs to select and change the values. Or double-tap on the field and use the virtual keypad to enter values.

Available only when Mark On is Identifier or ID & Data.

Data Bytes Sets the number of data bytes for which to search (one to eight bytes). Use the A knob to change the value.

Available only when Mark On is Data or ID & Data.

Data Offset Sets the data offset value. Use the A knob to change the value.

Available only when Mark On is Data or ID & Data.

Mark When Sets the mark when condition (mark the waveform when the waveform is is, ≠, <, >, ≤, or ≥ the data conditions).

Available only when Mark On is Data or ID & Data.

Data Sets the data pattern for which to search. The number of bits shown depends on the Data Bytes setting.

Tap the Binary or Hex field and use the A and B knobs to select and change the values. Or double-tap on the field and use the virtual keypad to enter values.

Available only when Mark On is Data or ID & Data.

Error Type Sets the error type for which to search and mark on the bus waveform. (Missing Ack, Bit Stuffing, or Any Error.

Available only when Mark On is Error.

A, B knob controls Use the A knob to select (highlight) the digit to change.

Use the B knob to change the value of the digit.

Copy Trigger Settings to Search Sets the search criteria to match the current oscilloscope trigger settings.
Copy Search Settings to Trigger Sets the current oscilloscope trigger settings to match the search criteria.

See also

Bus Trigger configuration

Bus Search configuration menus

CAN serial bus configuration menu

CAN serial bus search configuration menu (when using a .dbc symbol definition file)

Use the CAN Search configuration menu to define conditions to search for and mark on an CAN bus waveform. This menu supports searches for CAN bus events based on labels derived from a loaded .dbc symbol definition file.

Field or control Description
Display Enables or disables displaying waveform search marks for this search.
Act on Event Tap the Act on Event button to configure the actions the instrument must take when a search event occurs. See Act On Event configuration menu for the available fields and controls.
Results TableSets the results table as On or Off to see the active measurements, bus decode activity, and search results in a spreadsheet format. Default is off.
Search Type Set to Bus.
Source Select the CAN bus that you want to search and mark.
Mark On Sets the type of information for which to search and mark on the bus waveform acquisition.

Start of Frame puts a search mark at each occurrence of a CAN frame start.

FD Bits puts a search mark at each occurrence of the specified BRS Bit (Bit Rate Switch) and ESI Bit (Error State Indicator) states. Not available when the bus badge Decode Format is set to Symbolic.

End of Frame puts a search mark at each occurrence of a CAN frame end.

Error puts a search mark at each occurrence of the specified error condition (Missing Ack, Bit Stuffing, FD Form Error, or Any Error).

Symbolic puts a search mark at each occurrence of a specified message or signal condition as defined by an installed .dbc symbol definition file. Available only when the bus badge Decode Format is set to Symbolic.

Configure Opens the CAN DBC Symbolic Configuration menu, which sets the CAN bus search parameters based on the message and signal labeling derived from an installed .dbc symbol definition file. See CAN serial bus search configuration menu (when using a .dbc symbol definition file).
Message, Signal, and Value fields These fields display the actual search data values for the Message, Signal, and Value fields as set in the CAN DBC Symbolic Configuration menu. These fields are shown for reference and are not editable.
BRS Bits Sets the BRS (Bit Rate Switch) bit state for which to search and mark at each occurrence on the bus waveform.

Available only when Mark On is FD Bits.

ESI Bits Sets the ESI (Error State Indicator) bit state for which to search and mark at each occurrence on the bus waveform.

Available only when Mark On is FD Bits.

Error Type Sets the error type for which to search and mark on the bus waveform. (Missing Ack, Bit Stuffing, or Any Error.

Available only when Mark On is Error.

A, B knob controls Use the A knob to select (highlight) the digit to change.

Use the B knob to change the value of the digit.

Copy Trigger Settings to Search Sets the search criteria to match the current oscilloscope trigger settings.
Copy Search Settings to Trigger Sets the current oscilloscope trigger settings to match the search criteria.

See also

Bus Trigger configuration

Bus Search configuration menus

CAN serial bus configuration menu

CAN DBC Symbolic Configuration menu

Use this menu to set the CAN .dbc symbol definitions for which to search. This menu is accessed from a CAN Bus Search menu when a .dbc symbol definition file is loaded on the instrument. Load the .dbc file when you first add and configure the CAN bus.

Field or control Description
Symbolic Type Sets whether to search for Message CAN or search on both Message and Signal code.
Message Sets the CAN message label for which to search. Use the drop-down list to select from message labels derived from the installed .dbc file.
Signal Sets the CAN signal label for which to search. Use the drop-down list to select from signal labels derived from the installed .dbc file.
Signal Encoded Enables searching for encoded signal values (when selected) or specific values (when not selected). Use the drop-down list to select from encoded signal types derived from the installed .dbc file.

Value searching is always available for a signal. Signals, however, are not necessarily encoded, so searches on signal encoding are not always available.

Value Sets a specific Signal value for which to search. Use knob A to set a value, or double-tap the field and enter a value using the virtual keyboard.

See also

CAN serial bus search configuration menu (when using a .dbc symbol definition file)

CAN serial bus configuration menu

CAN serial bus configuration menu

LIN serial bus search configuration menu

Use the LIN Search configuration menu to define conditions to search for and mark on an LIN bus waveform. You can have multiple searches on the same bus.

Field or control Description
Display Enables or disables displaying search marks on this search.
Act on Event Tap the Act on Event button to configure the actions the instrument must take when a search event occurs. See Act On Event configuration menu for the available fields and controls.
Results TableSets the results table as On or Off to see the active measurements, bus decode activity, and search results in a spreadsheet format. Default is off.
Search Type Set to Bus.
Source Select the LIN bus that you want to search.
Mark On Select the type of information for which to search.
Identifier Sets the identifier pattern for which to search.

Tap the Binary, Hex, or Decimal field and use the A and B knobs to select and change the values. Or double-tap on the field and use the virtual keypad to enter values.

Available only when Mark On is Identifier or Identifier & Data.

Mark When Sets the mark when condition.

When set to Inside Range or Outside Range, fields are displayed to set a Data Low and Data High boundary pattern for the specified search range.

Available only when Mark On is Data or Identifier & Data.

Data Sets the data pattern for which to search. The number of bits shown depends on the Data Bytes setting.

Tap the Binary or Hex field and use the A and B knobs to select and change the values. Or double-tap on the field and use the virtual keypad to enter values.

Available only when Mark On is Data or Identifier & Data.

Data Bytes Sets the number of data bytes for which to search (one to four bytes). Use the A knob to change the value.

Available only when Mark On is Data or Identifier & Data.

Error TypeSets the error type for which to search. Tap the arrow and select the error condition.

Available when Mark On is Error.

A, B knob controls Use the A knob to select (highlight) the digit(s) to change.

Use the B knob to change the value of the digit(s).

Copy Trigger Settings to Search Sets the search criteria to match the current oscilloscope trigger settings.
Copy Search Settings to Trigger Sets the current oscilloscope trigger settings to match the search criteria.

See also

Bus Trigger configuration

Bus Search configuration menus

LIN serial bus configuration menu

SENT serial bus search configuration menu

Use the SENT Search configuration menu to define conditions to search for and mark on an SENT bus waveform. You can have multiple searches on the same bus.

Field or control Description
Display Enables or disables displaying search marks on this search.
Act on Event Tap the Act on Event button to configure the actions the instrument must take when a search event occurs. See Act On Event configuration menu for the available fields and controls.
Results TableSets the results table as On or Off to see the active measurements, bus decode activity, and search results in a spreadsheet format. Default is off.
Search Type Set to Bus.
Source Select the SENT bus that you want to search.
Mark On Select the type of information for which to search.
Status / Communications Sets the value of the status/communications nibble for which to search.

Tap the Binary or Hex field and use the A and B knobs to select and change the values. Or double-tap on the field and use the virtual keypad to enter values.

Available when Mark On is Fast Channel.

Fast Channel 1 Sets the condition and value of the fast channel 1 data for which to search.

Tap the down arrow and select the condition for which to search (=, ≠, >, <, ≥, ≤). The default is =.

Tap the Binary or Hex field and use the A and B knobs to select and change the values. Or double-tap on the field and use the virtual keypad to enter values.

Available when Mark On is Fast Channel.

Fast Channel 2 Sets the condition and value of the fast channel 2 data for which to search.

Tap the down arrow and select the condition for which to search (=, ≠, >, <, ≥, ≤). The default is =.

Tap the Binary or Hex field and use the A and B knobs to select and change the values. Or double-tap on the field and use the virtual keypad to enter values.

Available when Mark On is Fast Channel.

High Value, Low Value Sets the high and low values of data for fast channel 1 and 2 for which to search.

Available when Mark On is Fast Channel and Fast Channel 1 or Fast Channel 2 is Inside Range or Outside Range.

Counter Sets the condition and value of the counter data for which to search.

Tap the down arrow and select the condition for which to search (=, ≠, >, <, ≥, ≤). The default is =.

Tap the Binary or Hex field and use the A and B knobs to select and change the values. Or double-tap on the field and use the virtual keypad to enter values.

Available when Mark On is Fast Channel.

Inverted Nibble Sets the value of the inverted nibble data for which to search.

Tap the Binary or Hex field and use the A and B knobs to select and change the values. Or double-tap on the field and use the virtual keypad to enter values.

Available when Mark On is Fast Channel.

Message ID Sets the value of the message ID data for which to search.

Available when Mark On is Slow Channel.

Data Sets the condition and value of the slow channel data for which to search.

Tap the down arrow and select the condition for which to search (=, ≠, >, <, ≥, ≤). The default is =.

Tap the Binary or Hex field and use the A and B knobs to select and change the values. Or double-tap on the field and use the virtual keypad to enter values.

Available when Mark On is Slow Channel.

Mark When Sets the mark when condition.

Tap the down arrow and select the condition for which to search (=, ≠, >, <, ≥, ≤, Inside Range, Outside Range). The default is =.

When set to Inside Range or Outside Range, fields are displayed to set high and low boundary values for the number of clock ticks for which to mark.

Available when Mark On is Pause Pulse.

Number of Ticks Sets the number of Pause Pulse ticks for which to search.

Tap the Ticks High or Tick Low field and use the A and B knobs to set the values.

Available when Mark On is Pause Pulse and Mark When is set to =, ≠, >, <, ≥, or ≤.

Ticks High, Ticks Low) Sets the highest and lowest values for the range of Pause Pulse ticks for which to search.

Tap the Ticks High or Tick Low field and use the A and B knobs to set the values.

Available when Mark On is Pause Pulse and Mark When is Inside Range or Outside Range.

Error Type Sets the error type for which to search. Tap the arrow and select the error condition.

Available when Mark On is Error.

CRC Type Sets the CRC error type for which to search.

Available when Mark On is Error and Error Type is CRC.

Copy Trigger Settings to Search Sets the search criteria to match the current oscilloscope trigger settings.
Copy Search Settings to Trigger Sets the current oscilloscope trigger settings to match the search criteria.

See also

Bus Trigger configuration

Bus Search configuration menus

SENT serial bus configuration menu

Configure pattern editor

Use the pattern editor keypad to configure the pattern for the data or custom. To open the pattern editor, double-tap inside a Data/Custom field that requires alphanumeric values.

Data Pattern Editor

Table 1. Data Pattern Editor fields and controls
Keys Description
Entry field Sets the Data and hex values (D-XX). D is the data and XX is the hex value which can be 0-9 and A-F.
0-9 and A-F Sets the Hex value.
CLEAR Clears all values from the input entry field.
Bksp Deletes characters to the left of the insert text marker position.
Cancel Cancels all the values from the input entry field.
Enter Cancels all the values from the input entry field.

Custom Pattern Editor

Table 2. Custom Pattern Editor fields and controls
Keys Description
NULL Enters N in the input box.
FCT Enters F in the input box.
EOP Enters EOP in the input box.
EEP Enters EE in the input box.
T-XX Sets the timecode and the hex values (T-XX). T is the Timecode and XX is the hex value which can be 0-9 and A-F.
D-XX Sets the data and the hex values (T-XX). T is the data and XX is the hex value which can be 0-9 and A-F.
0-9 and A-F Sets the Hex value.
CLEAR Clears all values from the input entry field.
Bksp Cancels all the values from the input entry field.
Cancel Cancels all the values from the input entry field.
Enter Cancels all the values from the input entry field.
Note:A minimum of two patterns and maximum of eight patterns can be added. Each pattern should be separated by a space.

Edge Search configuration menu

Use the Edge search to mark when the specified edge condition occurs on an analog, digital, math, or reference waveform.

To create a new edge search:
  1. Tap Search.
  2. Set the Search Type to Edge.
  3. Select the search Source.
  4. Use the menu fields to set the search parameters.

To change the settings on an existing search, double-tap the search badge and make necessary changes.

Edge Search configuration menu fields and controls

Field or control Description
Display Sets the display of the mark icons to either On or Off. If you have multiple searches defined, the control turns off just the marks for the selected search.
Act On EventTap the Act on Event button to configure the actions the instrument must take when a search event occurs. See Act On Event configuration menu for the available fields and controls.
Results TableSets the results table as On or Off to see the active measurements, bus decode activity, and search results in a spreadsheet format. Default is off.
Stop Acquisition if Event Found

Stops input acquisition when the search event occurs. Default is not enabled.

Search Type Set to Edge.
Source Lists the source channel or waveform to use to trigger or search. Types that require multiple inputs will replace this control with a different source definition control.
Level Sets the amplitude level that the signal must pass through to be considered a valid transition.
Set to 50% Sets the threshold at 50% of the measured signal transition range. 50% is calculated as (Top + Bottom)/2.
Slope Sets the signal transition direction to detect. (rising, falling, or either direction).
Copy Trigger Settings to Search Sets the search criteria to match the current oscilloscope trigger settings.
Copy Search Settings to Trigger Sets the current oscilloscope trigger settings to match the search criteria.

Other search types

Bus Search configuration menus

Logic search configuration menu

Pulse Width Search configuration menu

Rise/Fall Time Search configuration menu

Runt Search configuration menu

Setup and Hold Search configuration menu

Timeout Search configuration menu

Logic search configuration menu

Use the Logic search to mark when specified logic conditions occur on an analog, digital, math, or reference waveform.

To create a new logic search:
  1. Tap Search.
  2. Set the Search Type to Logic.
  3. Use the menu fields to set the search parameters.

To change the settings on an existing search, double-tap the search badge and make necessary changes.

Logic Search configuration menu fields and controls

Field or control Description
Display Sets the display of the mark icons to either On or Off. If you have multiple searches defined, the control turns off just the marks for the selected search.
Act On EventTap the Act on Event button to configure the actions the instrument must take when a search event occurs. See Act On Event configuration menu for the available fields and controls.
Results TableSets the results table as On or Off to see the active measurements, bus decode activity, and search results in a spreadsheet format. Default is off.
Stop Acquisition if Event Found

Stops input acquisition when the search event occurs. Default is not enabled.

Search Type Set to Logic.
Use Clock Edge? Enables or disables finding logic patterns that occur on the specified clock edge.

Yes places marks on the clock waveform wherever the logic pattern occurs.

No places marks on the input signal waveform(s) wherever the logic pattern occurs.

Logic Pattern: Define Inputs Opens the Logic Search-Define Inputs configuration menu where you define the logic state (High, Low, or Don't Care), and the signal threshold level that defines the logic state for each analog or digital signal. See Define Inputs.
Mark When Defines the waveform logic event to mark, when Use Clock Edge is set to No.
  • Goes True: All conditions change to a true state.
  • Goes False: All conditions change to a false state.
  • Is True > Limit: Condition remains true longer than a specified time.
  • Is True < Limit: Condition remains true for less than a specified time.
  • Is True = Limit: Condition remains true for a specified time (within ± 5%).
  • Is True ≠ Limit: Condition does not remain true for a specified time (within ± 5%).
Clock Source Sets the signal to use as the clock. The clock source can be an analog, digital, math, or reference waveform. Available when Use Clock Edge is Yes.
Clock Edge Sets the polarity of the clock edge (rising or falling) for evaluating the other menu conditions. The Logic menu also lets you set the clock edge to either edge. Available when Use Clock Edge is Yes.
Clock Threshold Sets the threshold level that the clock signal must pass through to be considered a valid transition. The clock threshold value is independent of the input signal threshold(s). Available when Use Clock Edge is Yes.
Define Logic
Sets the logic condition that must occur with all inputs.
  • AND: All conditions are true.
  • OR: Any condition is true.
  • NAND: One or more conditions are true.
  • NOR: No conditions are true.
Copy Trigger Settings to Search Sets the search criteria to match the current oscilloscope trigger settings.
Copy Search Settings to Trigger Sets the current oscilloscope trigger settings to match the search criteria.

Other search types

Bus Search configuration menus

Edge Search configuration menu

Pulse Width Search configuration menu

Rise/Fall Time Search configuration menu

Runt Search configuration menu

Setup and Hold Search configuration menu

Timeout Search configuration menu

Logic Search - Define Inputs configuration menu

Use the Define Inputs menu to select the logic condition to search on, and the logic threshold value, for each channel.

To open the Logic Search-Define Inputs configuration menu:
  1. Double-tap a Logic Search badge on the Settings bar.
  2. Tap the Logic Pattern > Define Inputs invoker button.

Logic Search - Define Inputs configuration menu fields and controls

Field or control Description
Ch(x) (analog channels) or D(x) (digital Channels) Use to select the signal sources logic condition on which to perform the logic search (High, Low, Don't Care).

If a channel is a digital channel, tap the + symbol to open the list of digital inputs (D15-D0) from which to select individual logic conditions for the digital signals.

To set the threshold levels for digital channels, double-tap the digital Channel badge to open its configuration menu.

Use the Threshold field to set the signal level that must be exceeded for that signal to be true (logical 1).

Set All Sets all signal sources to detect a logic High, Low, or Don't Care condition.

Pulse Width Search configuration menu

Use the Pulse Width search to mark a waveform whenever the specified pulse width condition occurs.

To create a new pulse width search:
  1. Tap Search.
  2. Set the Search Type to Pulse Width.
  3. Select the search Source.
  4. Use the menu fields to set the search parameters.

To change the settings on an existing search, double-tap the search badge and make necessary changes.

Pulse Width Search menu fields and controls

Field or control Description
Display Sets the display of the mark icons to either On or Off. If you have multiple searches defined, the control turns off just the marks for the selected search.
Act On EventTap the Act on Event button to configure the actions the instrument must take when a search event occurs. See Act On Event configuration menu for the available fields and controls.
Results TableSets the results table as On or Off to see the active measurements, bus decode activity, and search results in a spreadsheet format. Default is off.
Stop Acquisition if Event Found

Stops input acquisition when the search event occurs. Default is not enabled.

Search Type Set to Pulse Width.
Source Lists the source channel or waveform to use to trigger or search. Types that require multiple inputs will replace this control with a different source definition control.
Mark When
  • < Limit: A pulse width is less than the specified time limit.
  • > Limit: A pulse width is greater than the specified time limit.
  • = Limit: A pulse width is equal to the specified time limit.
  • ≠ Limit: A pulse width does not equal (is greater than or less than) the specified time limit.
  • Inside Range: A pulse width is in the specified time range.
  • Outside Range: A pulse width is outside of the specified time range.
Level Sets the amplitude level that the signal must pass through to be considered a valid transition.
Set to 50% Sets the threshold at 50% of the measured signal transition range. 50% is calculated as (Top + Bottom)/2.
Time Limit Sets the time period condition to be met.
High Time Limit Sets the longest acceptable pulse width time period for the range condition.

Available only when Mark When is Inside Range or Outside Range.

Low Time Limit Sets the shortest acceptable pulse width time period for the range condition.

Available only when Mark When is Inside Range or Outside Range.

Polarity Sets the polarity of the pulse to detect (positive pulse only, negative pulse only, or a positive or negative pulse).
Copy Trigger Settings to Search Sets the search criteria to match the current oscilloscope trigger settings.
Copy Search Settings to Trigger Sets the current oscilloscope trigger settings to match the search criteria.

Other search types

Bus Search configuration menus

Edge Search configuration menu

Logic search configuration menu

Rise/Fall Time Search configuration menu

Runt Search configuration menu

Setup and Hold Search configuration menu

Timeout Search configuration menu

Rise/Fall Time Search configuration menu

Use the Rise/Fall Time search to mark occurrences where the rise or fall time is less than, greater than, equal to, or not equal to a specified time limit.

To create a new rise/fall time search:
  1. Tap Search.
  2. Set the Search Type to Rise/Fall Time.
  3. Select the search Source.
  4. Use the menu fields to set the search parameters.

To change the settings on an existing search, double-tap the search badge and make necessary changes.

Rise/Fall Time Search configuration menu fields and controls

Field or control Description
Display Sets the display of the mark icons to either On or Off. If you have multiple searches defined, the control turns off just the marks for the selected search.
Act On EventTap the Act on Event button to configure the actions the instrument must take when a search event occurs. See Act On Event configuration menu for the available fields and controls.
Results TableSets the results table as On or Off to see the active measurements, bus decode activity, and search results in a spreadsheet format. Default is off.
Stop Acquisition if Event Found

Stops input acquisition when the search event occurs. Default is not enabled.

Search Type Set to Rise/Fall Time.
Source Lists the source channel or waveform to use to trigger or search. Types that require multiple inputs will replace this control with a different source definition control.
Mark When
  • < Limit: A signal has a rise/fall time less than the specified time limit.
  • > Limit: A signal has a rise/fall time greater than the specified time limit.
  • = Limit: A signal has a rise/fall time that is equal to the specified time limit (±5%).
  • ≠ Limit: A signal has a rise/fall time that does not equal (is greater than or less than) the specified time limit (±5%).
Time Limit Sets the time period condition to be met.
Slope Sets the signal transition direction to detect. (rising, falling, or either direction).
Upper Threshold

Sets the upper amplitude level through which the signal must pass to be considered a valid transition.

Lower Threshold

Sets the lower amplitude level through which the signal must pass to be considered a valid transition.

Copy Trigger Settings to Search Sets the search criteria to match the current oscilloscope trigger settings.
Copy Search Settings to Trigger

Sets the current oscilloscope trigger settings to match the search criteria.

Other search types

Bus Search configuration menus

Edge Search configuration menu

Logic search configuration menu

Pulse Width Search configuration menu

Runt Search configuration menu

Setup and Hold Search configuration menu

Timeout Search configuration menu

Runt Search configuration menu

Use the Runt search to mark a waveform where a pulse crosses one threshold but fails to cross a second threshold before recrossing the first threshold.

To create a new runt search:
  1. Tap Search.
  2. Set the Search Type to Runt.
  3. Select the search Source.
  4. Use the menu fields to set the search parameters.

To change the settings on an existing search, double-tap the search badge and make necessary changes.

Runt Search configuration menu fields and controls

Field or control Description
Display Sets the display of the mark icons to either On or Off. If you have multiple searches defined, the control turns off just the marks for the selected search.
Act On EventTap the Act on Event button to configure the actions the instrument must take when a search event occurs. See Act On Event configuration menu for the available fields and controls.
Results TableSets the results table as On or Off to see the active measurements, bus decode activity, and search results in a spreadsheet format. Default is off.
Stop Acquisition if Event Found

Stops input acquisition when the search event occurs. Default is not enabled.

Search Type Set to Runt.
Source Lists the source channel or waveform to use to trigger or search. Types that require multiple inputs will replace this control with a different source definition control.
Mark When
  • Occurs: A runt signal event occurs.
  • < Limit: A runt signal event occurs that has a pulse width less than the specified time limit.
  • > Limit: A runt signal event occurs that has a pulse width greater than the specified time limit.
  • = Limit: A runt signal event occurs that has a pulse width that is equal to the specified time limit (±5%).
  • ≠ Limit: A runt signal event occurs that has a pulse width that does not equal (is greater than or less than) the specified time limit (±5%).
Polarity Sets the polarity of the pulse to detect (positive pulse only, negative pulse only, or a positive or negative pulse).
Time Limit Sets the time period condition to be met.

Available only when Mark When = < Limit, > Limit, = Limit, or != Limit.

Upper Threshold

Sets the upper amplitude level through which the signal must pass to be considered a valid transition.

Lower Threshold

Sets the lower amplitude level through which the signal must pass to be considered a valid transition.

Copy Trigger Settings to Search Sets the search criteria to match the current oscilloscope trigger settings.
Copy Search Settings to Trigger Sets the current oscilloscope trigger settings to match the search criteria.

Other search types

Bus Search configuration menus

Edge Search configuration menu

Logic search configuration menu

Pulse Width Search configuration menu

Rise/Fall Time Search configuration menu

Setup and Hold Search configuration menu

Timeout Search configuration menu

Setup and Hold Search configuration menu

Use the Setup and Hold search type to mark a waveform when a data signal changes state inside of a specified setup and hold time, relative to a specified clock signal.

To create a new setup and hold search:
  1. Tap Search.
  2. Set the Search Type to Setup & Hold.
  3. Select the search Clock Source.
  4. Use the menu fields to set the search parameters.

To change the settings on an existing search, double-tap the search badge and make necessary changes.

Setup & Hold Search configuration menu fields and controls

Field or control Description
Display Sets the display of the mark icons to either On or Off. If you have multiple searches defined, the control turns off just the marks for the selected search.
Act On EventTap the Act on Event button to configure the actions the instrument must take when a search event occurs. See Act On Event configuration menu for the available fields and controls.
Results TableSets the results table as On or Off to see the active measurements, bus decode activity, and search results in a spreadsheet format. Default is off.
Stop Acquisition if Event Found

Stops input acquisition when the search event occurs. Default is not enabled.

Search Type Set to Setup & Hold.
Clock Source Sets the signal to use as the clock. The clock source can be an analog, digital, math, or reference waveform.
Clock Level Sets the threshold level that the clock signal must pass through to be considered a valid transition. The clock threshold value is independent of the input signal threshold(s).
Clock Edge Sets the polarity of the clock edge (rising or falling) for evaluating the other menu conditions. The Logic menu also lets you set the clock edge to either edge.
Data Sources Sets the data signal source(s). All selected sources must meet the specified setup and hold times. See Setup and Hold Search - Define Inputs configuration menu.
Setup Time Sets the length of time that data signal should be stable and not change before a clock edge occurs.
Hold Time Sets the length of time that data signal should be stable and not change after a clock edge occurs.
Copy Trigger Settings to Search Sets the search criteria to match the current oscilloscope trigger settings.
Copy Search Settings to Trigger Sets the current oscilloscope trigger settings to match the search criteria.

Other search types

Bus Search configuration menus

Edge Search configuration menu

Logic search configuration menu

Pulse Width Search configuration menu

Rise/Fall Time Search configuration menu

Runt Search configuration menu

Timeout Search configuration menu

Setup and Hold Search - Define Inputs configuration menu

Use the Define Inputs menu to select the data signal source(s) and set their threshold level(s).

To open the Setup & Hold Search - Define Inputs menu:
  1. Double-tap a Setup & Hold Search badge on the Results bar.
  2. Tap the Data Sources > Define Inputs button.

Setup and Hold Search - Define Inputs configuration menu fields and controls

Field or control Description
Ch(x) (analog channels) or D(x) (digital Channels Use to add (Include) or exclude (Don't Include) the data signal(s) from available input channels and waveforms.

If a channel is a digital channel, tap the + symbol to open the list of digital inputs (D15-D0) from which to select for that channel.

To set the threshold levels for digital channels, double-tap the digital Channel badge to open its configuration menu.

For analog channels, use the threshold field to set the data signal level that must be exceeded for the signal transition to be true.

Set All Use to Include or Don't Include all available channels and waveforms as data signals.

Timeout Search configuration menu

Use the Timeout search to mark a waveform when it does not detect an expected pulse transition within a specified period of time, such as when a signal gets stuck either high or low.

To create a new timeout search:
  1. Tap Search.
  2. Set the Search Type to Timeout.
  3. Select the search Source.
  4. Use the menu fields to set the search parameters.

To change the settings on an existing search, double-tap the search badge and make necessary changes.

Timeout Search menu fields and controls

Field or control Description
Display Sets the display of the mark icons to either On or Off. If you have multiple searches defined, the control turns off just the marks for the selected search.
Act On EventTap the Act on Event button to configure the actions the instrument must take when a search event occurs. See Act On Event configuration menu for the available fields and controls.
Results TableSets the results table as On or Off to see the active measurements, bus decode activity, and search results in a spreadsheet format. Default is off.
Stop Acquisition if Event Found

Stops input acquisition when the search event occurs. Default is not enabled.

Search Type Set to Timeout.
Source Lists the source channel or waveform to use to trigger or search. Types that require multiple inputs will replace this control with a different source definition control.
Mark When
  • Stays High: The signal stays above the specified threshold level longer than the specified time.
  • Stays Low: The signal stays below the specified threshold level longer than the specified time.
  • Either: The signal stays above or below the specified threshold level longer than the specified time.
Threshold Sets the amplitude level that the signal must pass through to be considered a valid transition.
Set to 50% Sets the threshold at 50% of the measured signal transition range. 50% is calculated as (Top + Bottom)/2.
Time Limit Sets the time period condition to be met.
Copy Trigger Settings to Search Sets the search criteria to match the current oscilloscope trigger settings.
Copy Search Settings to Trigger Sets the current oscilloscope trigger settings to match the search criteria.

Other search types

Bus Search configuration menus

Edge Search configuration menu

Logic search configuration menu

Pulse Width Search configuration menu

Rise/Fall Time Search configuration menu

Runt Search configuration menu

Setup and Hold Search configuration menu

Analog Channel configuration menu

Use the Analog Channel configuration menu to set up analog channel vertical settings, probe settings, and deskew settings for the channel.

To open an analog Channel configuration menu, double-tap an analog Channel badge. The following text describes analog channel settings.

Vertical Settings panel, fields and controls

Field or control Description
Display Enables (On) or disables (Off) displaying the channel waveform in the Waveform View window.
Invert Reverses the amplitude polarity of each sample point. When On, Invert adds a down arrow symbol to the channel badge.
Vertical Scale Sets the vertical scale using the multipurpose knob, double-tap to bring up the virtual keypad, or tap the up and down arrows to change the scale.
Offset Sets the channel signal vertical offset.
Set to 0 Sets the channel signal vertical offset to 0 units.
Position Double-tap the field to set the vertical position using the virtual keypad.
Set to 0 Tap to set the waveform zero volt level to the center of the slice or waveform view.
Label Double-tap the field to add a label to the channel display using the virtual keypad.
Bandwidth Limit Tap to select the bandwidth limit from the drop-down list.
Coupling Tap to set the input coupling to DC or AC.

Probe Setup panel (Channel configuration menu)

Use the Channel configuration menu Probe Setup panel to setup probe, deskew.

To open the Probe Setup panel:

  1. Double-tap an analog Channel badge on the Settings bar to open the Channel configuration menu.
  2. Tap the Probe Setup panel.

Probe Setup panel fields and controls

Available fields and controls vary with the type of probe that is attached. For more information, consult the probe documentation.

Field or controlDescription
Probe TypeSets the probe type as Voltage or Current.
DeskewSets or displays the probe deskew value.
Set to 0Sets the probe deskew value to zero (0) seconds.
AttenuationSet attenuation as 1X, 10X, or Custom.
Custom Attenuation Set the value for Custom Attenuation. Available when Attenuation is Custom.
Measure CurrentMeasures the current. Available when Probe Type is Voltage.
RatioDouble-tap the numeric fields to set the ratio using the virtual keypad. Available when Probe Type is Voltage and Measure Current is Yes.
Set to UnitySets the ratio to unity. Available when Probe Type is Voltage and Measure Current is Yes.

Probe error messages are also displayed in this setup panel, see Error Messages and Badges.

Invert channel guidelines

This topic describes how the channel Invert function interacts with other instrument settings.

Settings that change when Invert is set to On or Off:

  • The instrument clears acquisitions and restarts triggering
  • All persistence information resets/clears, including all waveform statistics, etc
  • All associated views and derived results change. For example, XY view, cursor readouts, measurement results, search results, math, bus decode, and so on, all change to reflect the current Invert setting

Settings that change when Invert is set to On:

  • The instrument adds a down arrow to the title row of the channel badge to indicate inverted mode
  • The channel Offset value reverses polarity
  • The trigger level value reverses polarity
  • The trigger level indicator moves to the inverted value and the trigger level bar appears momentarily to show the new level
  • The trigger Slope indicator on the Trigger badge and in its menu changes to the opposite edge (Rising to Falling, or Falling to Rising). If the Either edge mode is selected then slope mode does not change

Settings that don't change when Invert is On:

  • The channel Vertical scale does not change
  • The channel Vertical position knob rotation direction does not change
  • The channel Vertical Position value does not change
  • The Trigger level knob rotation direction does not change

Invert and Setup, Autoset, and Default functions

  • The invert state is saved and recalled correctly as part of Setup and Session files
  • Autoset does not affect Invert
  • Default sets Invert to Off

AFG configuration menu

Use the AFG configuration menu to set the output signal parameters for the optional arbitrary/function generator. Use the AFG to simulate signals within a design or add noise to signals to perform margin testing.

To open the AFG configuration menu:

  1. Tap the AFG PG > AFG on the Settings bar. The oscilloscope shows the AFG configuration menu. You can change the AFG settings while the output is Off.
  2. Tap Continuous or Burst to add the AFG badge to the Settings bar.
  3. Double-tap the AFG badge to open the AFG menu.

Arbitrary/Function Generator overview

The function generator provides output of predefined waveforms up to 50 MHz. Choose between Sine, Square, Pulse, Ramp, DC, Noise, Sin(x)/x, Gaussian, Lorentz, Exponential Rise, Exponential Decay, Haversine, Cardiac, and Arbitrary signals.

You can also select a predefined waveform or load a saved .wfm- or .csv-format waveform from storage (USB drive, a network drive or TekDrive on instruments with Windows OS installed).

Arbitrary/Function Generator menu fields and controls

Not all items listed in the table may be shown for all measurements. The configuration menu only shows fields and controls relevant to the selected Waveform Type.

The output connector is on the front panel, labeled AFG/Aux Out.

Field or control Description
Output Tap to toggle between the output Off, Continuous, or Burst.
CyclesSpecify the number of cycles in the text field. Default cycle value is 1.

Available when Output is Burst

When Output is selected as Burst, a Burst button is displayed on the AFG badge. Click the Burst button on the badge to generate the signal burst.

Waveform Type Tap to select an available waveform from the list.
Load Tap to open the Directory configuration menu. Navigate to and select a waveform file to load into the AFG memory. You can navigate to TekDrive to load saved waveform files.

Available when Waveform Type is Arbitrary.

Waveform File Shows the loaded waveform file path and name. Tap to select a waveform file to load into the AFG waveform memory from the drop-down list of the last 20 waveforms that have been loaded using the Load button.
Symmetry Sets the symmetry of the ramp using the keypad or multipurpose knob.

Available when the Waveform Type is Ramp.

Width Sets the width of the pulse using the keypad or multipurpose knob.

Available when the Waveform Type is Pulse.

Duty Cycle Sets the duty cycle of the square wave using the keypad or multipurpose knob.

Available when the Waveform Type is Square.

Frequency Sets the frequency of the waveform using the keypad or multipurpose knob. The frequency range is 0.1 Hz to 50 MHz, in increments of 0.1 Hz.
Period Sets the period of the waveform using the keypad or multipurpose knob.
Amplitude Sets the amplitude of the waveform using the keypad or multipurpose knob
Offset Sets the offset of the waveform using the keypad or multipurpose knob.
High Level Sets the High signal amplitude of the waveform using the keypad or multipurpose knob
Low Level Sets the low signal amplitude of the waveform using the keypad or multipurpose knob.
Load Impedance Tap to select either 50 Ω or High Z (1 MΩ) output load impedance.
Add Noise Tap the check box to toggle noise on and off. Set the amount of noise to add to the output signal using the keypad or the multipurpose controls.

AFG output amplitude ranges by impedance (peak to peak)

Waveform 50 Ω High Z
Sine 10 mV to 2.5 V 20 mV to 5 V
Square 10 mV to 2.5 V 20 mV to 5 V
Pulse 10 mV to 2.5 V 20 mV to 5 V
Ramp 10 mV to 2.5 V 20 mV to 5 V
DC 0 V to ±1.25 V 0 V to ±2.5 V
Noise 10 mV to 2.5 V 20 mV to 5 V
Sine(x)/x 10 mV to 1.5 V 20 mV to 3 V
Gaussian 10 mV to 1.25 V 20 mV to 2.5 V
Lorentz 10 mV to 1.2 V 20 mV to 2.4 V
Exponential Rise 10 mV to 1.25 V 20 mV to 2.5 V
Exponential Decay 10 mV to 1.25 V 20 mV to 2.5 V
Haversine 10 mV to 1.25 V 20 mV to 2.5 V
Cardiac 10 mV to 2.5 V 20 mV to 5 V
Arbitrary 10 mV to 2.5 V 20 mV to 5 V

Cursor configuration menu

Cursors are on-screen lines (bars) that you position in a Waveform or Plot views to take manual measurements on signals. They appear as horizontal and/or as vertical lines.

To open the Cursors configuration menu:
  1. Double-tap a cursor readout or cursor line, or
  2. Touch and hold a cursor readout or cursor line and select Configure Cursors from the right-click menu.

To display cursors on the screen, tap the Cursors button on the display.

Cursor configuration menu fields and controls

Some fields or controls are available only when certain other controls are selected.

Field or control Description
Display Tap to toggle the cursor display On or Off.
Readout Location Tap to set where to display cursor readouts.

Graticule displays the cursor readouts on the screen cursor bars (default method). You can move the readouts on cursors by touching and dragging them along the cursor bar.

Badge removes the screen cursor readouts and displays the cursor information in a Cursors badge in the Results bar. The Cursors badge content changes as you change the cursor type.

Cursor Type Tap to select the cursor type from the drop-down list.

Waveform cursors measure vertical amplitude and horizontal time parameters simultaneously at the point the cursor intersects a waveform. The cursor intersect point tracks waveform amplitude changes.

V Bars are vertical cursors that measure horizontal parameters (typically time). They are not associated with the waveform, but show the time position of the cursor in the waveform record.

H Bars are horizontal cursors that measure amplitude (typically in volts or amperes). They are not associated with the waveform, but show the amplitude position of the cursor.

V&H Bars cursors measure vertical and horizontal parameters simultaneously. They are not associated with the waveform, but show the time and amplitude position of the cursors.

Source Waveform Tap to select the source waveform (the waveform on which to display the cursors).

Same places both cursors on the same waveform.

Split allows each cursor to be on a different waveform.

Available when Cursor Type is Waveform.

If Source is set to All then the Source Waveform is unavailable.

Readout Type Tap to select the type of readout to display for a XY plot. This control is only available when the Cursor Type is set to Waveform or V&H Bars.

Rectangular displays the position values and the difference (delta) between cursors.

Polar displays the polar information for each cursor. The top value is the magnitude of the vector drawn from the origin of the plot to the location of the cursor. The bottom value is the angle of the vector drawn from the origin of the plot to the location of the cursor.

Source Tap to select the source waveform from the drop-down list. Selected Waveform automatically moves the waveform cursors to the selected source or select a specific source from the drop-down list.

Available when Source Waveform is Same.

All is available in Source drop-down list only when the Cursor Type is set to Waveform.

All waveforms includes time domain based math waveforms, reference waveforms, trend waveforms, etc.

Cursor A Source, Cursor B Source Tap to select the waveform sources for Cursor A and B.

Available when Source Waveform is Split.

Cursor A X-Position Tap to set a specific x-axis position for Cursor A using the multipurpose knob, or double-tap to set the position using the keypad.
Cursor B X-Position Tap to set a specific x-axis position for Cursor B using the multipurpose knob, or double-tap to set the X-Position using the keypad.
Cursor A Y-Position Tap to set a specific Y-axis position for Cursor A using the multipurpose knob, or double-tap to set the position using the keypad.

Available when Cursor Type is H Bars or V&H Bars.

Cursor B Y-Position Tap to set a specific Y-axis position for Cursor B using the multipurpose knob, or double-tap to set the X-Position using the keypad.

Available when Cursor Type is H Bars or V&H Bars.

Cursor Mode Tap to select the cursor mode.

Independent mode sets multipurpose knobs A and B to move each cursor separately.

Linked mode sets multipurpose knob A to move both cursors at the same time. Knob B will still move cursor B independently of knob A.

Date and Time configuration menu

Use this menu to set the date, time format, and time zone.

To open the Date and Time configuration menu, double-tap on the Date/Time badge in the lower-right corner of the oscilloscope display.

Date and Time configuration menu fields and controls

Field or control Description
Display Tap to toggle display of the date and time On or Off.

When turned off, double-tap on the blank area below the Run/Stop button, in the lower-right corner of the oscilloscope display, to open the configuration menu and set display to On.

Time Format Tap to select either 12 Hour or 24 Hour time format.
Time Zone Tap and select the desired time zone from the drop-down list.
Automatically adjust clock for Daylight Saving Time Sets the oscilloscope to automatically change the time to account for Daylight Saving Time changes.
Note:You cannot set a specific time; the time is preset at the factory.

Digital channel configuration menu

Use the digital channel menu to enable individual digital channels, set their thresholds (individually or as a group), and add labels.

To open the digital channel configuration menu, double-tap a digital channel badge. You can also double-tap on the digital channel handles to open the menu.

Digital channel settings fields and controls

Field or control Description
Display Tap to toggle display of the channel On and Off.
Label Enter label text for the overall data channel.
Height Sets the relative height of the digital waveform on the screen.

Available when Waveform View mode is Overlay Display Mode.

D15-D0 Bit Tap to toggle individual channels (bits) On or Off and remove them from the display.
D15-D0 Label Enter label text for individual data channels. The label is shown to the right of the corresponding digital channel.
D15-D8 or D7-D0 Turn All Off Turns off the digital channel.
Thresholds Use to set all data channels to the same threshold value. Enter a value in the field and tap the button.

Right-click menu

A right click (touch and hold) on the digital waveform handle opens a menu to turn off that instrument channel, configure the overall digital channel settings, or add a label to the digital channel.

See also

Analog channel configuration menu

Horizontal configuration menu

Use Horizontal menu to select the horizontal mode, set horizontal parameters, and enable trigger delay.

To open the Horizontal configuration menu, double-tap the Horizontal badge in the Settings bar.

Horizontal configuration menu fields and controls

Field or control Description
Horizontal Mode Tap to select either Automatic or Manual horizontal mode.

In Automatic mode you can set the Minimum Sample Rate and Horizontal Scale.

In Manual mode you can set the Sample Rate and Record Length. Horizontal Scale is a dependent variable calculated from the sample rate and record length.

Minimum Sample Rate Sets the minimum sample rate for acquisitions. Changing horizontal scale will not reduce the sample rate below this value. This can result in partial waveform records at lower frequencies, but at the same time would provide more sample points for a few cycles of the signal.

Available when Horizontal Mode is Automatic.

This setting can be overridden if Allow Horizontal Scale to Override Min Sample Rate is selected.

Allow Horizontal Scale to Override Min Sample Rate Select to set the oscilloscope to automatically change the sample rate to acquire a full waveform record. Changes to the sample rate are shown in the Horizontal badge readout, not in the Minimum Sample rate field of the menu.

Available when Horizontal Mode is Automatic.

Horizontal Scale Tap to set the Horizontal Scale using the assigned multipurpose knob, double-tap to set the scale using the virtual keypad, or tap the up and down arrows. You can also use the front-panel Horizontal Scale knob to change this value.

The horizontal scale determines the size of the acquisition window relative to the waveform. You can scale the window to contain a single waveform edge, a single cycle, several cycles, or thousands of cycles.

Delay Delay positions the trigger event to a specified time relative to the center of the waveform record. Use delay to focus on events that occur before (pre-trigger) or after the trigger point (post-trigger).
Position Tap to set the trigger Position using the assigned multipurpose knob or double-tap to set the Position using the virtual keypad.

When horizontal Delay is on, the time from the trigger point to the horizontal reference (center of waveform record) is the horizontal delay. The horizontal position determines the number of pre-trigger and post-trigger samples in the waveform record.

When horizontal delay is off, the trigger point and the horizontal reference are at the same time in the middle of the waveform record.

Set to 0 s Tap to set the delay position to 0 s (center of the waveform record.

Available only when Delay is On.

Set to 10% Tap to set the trigger delay to 10% of the waveform record.

Available only when Delay is Off.

Sample Rate Changes Affect Tap to allow changes to the Sample Rate to affect either the Horizontal Scale or the Record Length.

Available only when Horizontal Mode is Manual.

Sample Rate Tap to set the Sample Rate using the assigned multipurpose knob, double-tap to set the rate using the virtual keypad, or tap the up and down arrows. This keeps the oscilloscope at the specified sample rate regardless of the horizontal or record length settings. This limits the available horizontal scale settings to those that can be used with the specified sample rate.

Available only when Horizontal Mode is Manual.

Record Length Tap to set the Record Length using the assigned multipurpose knob, double-tap to set the length using the virtual keypad, or tap the up and down arrows.

Available only when Horizontal Mode is Manual.

Acquisition configuration menu

Use this configuration menu to set which data points are used to acquire waveforms, and enable automatically saving acquisitions to files.

The Acquisition menu fields and controls

To open the Acquisition menu, double-tap the Horizontal, tap the Acquisition Settings on the Settings bar.

Displayed fields and controls can change depending on menu selections.

Field or control Description
Run/Stop Toggles the oscilloscope between constant acquisition (Run) and no acquisitions (Stop). When stopped, the oscilloscope shows waveforms from the last completed acquisition.
Single/Seq Acquires a single acquisition or a set number of acquisitions, then stops.
Clear Erases acquired waveform data points from memory. Applies to all live acquisition waveforms.
Acquisition Mode Sample creates a record point by saving one or more samples during each acquisition interval. Sample mode is the default acquisition mode. The instrument does no post processing of the acquired samples in this mode.
Peak Detect alternates between saving the highest sample in one acquisition interval and the lowest sample in the next acquisition interval. Useful for capturing fast and random events such as narrow waveform pulses.
High Res applies unique finite impulse response (FIR) filters based on the current sample rate. This FIR filter maintains the maximum bandwidth possible for that sample rate while rejecting aliasing. The filter removes noise from the oscilloscope amplifiers and ADC above the usable bandwidth for the selected sample rate. Implementation of the filter in hardware, ahead of the trigger and storage, reduces trigger jitter. High Res mode also guarantees at least 12 bits of vertical resolution. The High Res sample rate and record length settings are displayed in the Horizontal badge. High Res mode sets the maximum real time sample rate to half the maximum sample rate.
Envelope acquires and displays a waveform record that shows the extremes in variations over several acquisitions. The instrument saves the highest and lowest values in two adjacent intervals (similar to the Peak Detect mode). Unlike Peak Detect mode, the peaks are gathered over many trigger events.
Average acquires and displays a waveform record that is the average result of several acquisitions. This mode reduces random noise.
Roll Mode scrolls sequential waveform points across the display in a right-to-left rolling motion. Roll Mode starts automatically when the timebase is set to ≥40 ms/div. Roll Mode works at sample rates up to 25 MS/s.
Number of WaveformsSets the number of waveforms for the average result of several acquisitions. Available when Acquisition Mode is Average.
Single Sequence/Stop After Enables stopping acquisitions after a specified number of acquisitions. Only works when using the Single/Sequence button.
XYToggles the XY On or Off to plot the XY plot. Default is Off.

More (DRAW A BOX Menu)

Use this menu to toggle the Waveform view box draw mode between Zoom area mode and Mask segment mode.

To use the More (DRAW A BOX) menu:
  1. Double-tap the More button (located at the top right of the Results Bar) to open the DRAW A BOX window.
  2. Tap Zoom on the DRAW A BOX window to enable drawing a zoom box area on the screen. The mode stays in Zoom mode until changed.
  3. Tap Mask on the DRAW A BOX window to enable drawing Mask Testing segments on the screen. The mode stays in Mask mode until changed.
  4. Tap outside the menu. The DRAW A BOX icon changes to reflect the function available when you next select the DRAW A BOX icon.

See also

Mask testing waveforms

Mask Badge configuration menu

Use the Mask Badge configuration menu to set the total number of eye diagram mask hits needed to fail the mask test.

Prerequisite: An Eye Diagram plot with a mask enabled.

To open the Mask Badge configuration menu, double-tap a Mask badge in the Results column.

Mask Badge configuration menu fields and controls

Field or control Description
Total Sets the total number of hits needed to fail an eye mask test.

Mask Definition configuration menu

Use the Mask Definition menu to edit mask segment parameters. Double tapping a mask segment opens the Mask Definition configuration menu.

To open the Mask Definition menu, double-tap on a mask segment.

To create a mask segment, see Create a Mask

Mask Settings panel fields and controls

Field or control Description
Mask Defined By Define the way you edit the mask. The default option is Segments.
Shape Lists the current shape type, and also lets you change the current shape to a specified shape. Changing a shape defines the minimum rectangle that includes all vertices of the current segment, and then does a best-fit approach to create the specified shape.

If you made changes to a default shaped segment that results in an segment that no longer meets the default shape definition, that segment is listed as a Custom shape in the menu.

Height Sets the segment height, in amplitude units, between the topmost vertex and the bottommost vertex.
Vertical Center Sets the segment vertical center, in amplitude units, as the point halfway between the topmost vertex and bottommost vertex.
Flip Vertical Flips the segment vertically around its Vertical Center value.
Width Sets the segment width, in time units, between the leftmost vertex and the rightmost vertex.
Horizontal Center Sets the segment horizontal center, as time units, as the point halfway between the leftmost vertex and rightmost vertex.
Flip Horizontal Flips the segment horizontally around its Horizontal Center value.
Rotate Rotates the segment in units of degrees, from 0° to 360°.

The rotation is an absolute angle measurement referenced from 0°, where 0° is the position of the segment when it was first created. For example, if you rotate the segment 40°, and then rotate it again with 20°, the resulting segment rotation is 20°.

The segment height and width are relative to the current segment orientation, and automatically change places as needed when the segment is rotated.

Tolerance Type Sets the tolerance type as Screen or Absolute. Default type is screen.
Vertical ToleranceTap the Vertical Tolerance field and enter the tolerance value as divisions of the current channel settings (volts, amps, and so on). Or double-tap on the field and use the A knob to change the value.
Horizontal Tolerance Tap the Horizontal Tolerance field and enter the tolerance value as divisions of the current channel settings (volts, amps, and so on). Or double-tap on the field and use the A knob to change the value.
Update Mask Now Updates the mask as per the configured tolerance values.

Edit Vertices panel fields and controls

Field or control Description
Define Segment A table that lists the X (time) and Y (amplitude) values for each vertex (point) of the segment. Use the scroll bar to show points if there are more than nine points in the segment.

Selecting a row in the table highlights the associated vertex on the segment.

Use the Multipurpose knobs to change the value of the X or Y settings, or double-tap a setting and enter the value directly.

Insert Point Inserts a new row above the selected row and creates a new vertex on the segment shape. The new vertex is halfway between the vertices defined in the prior row and the following row in the table.
Delete Point Deletes the currently selected point, keeps the row selected, and moves all rows below it up one row.

The Delete Point button is not available when a triangular segment is selected.

Reset Points Deletes all but three data points from the table. The remaining three data points are set to a default triangle, set to two divisions for height and width, and centered in the waveform area.
Note:Redo and Undo are available for most Edit Vertices panel controls.

Save panel fields and controls

Field or control Description
Save Mask Saves the mask in the desired location with the given file name.

Mask Definition right click menu

See Right click menu functions associated with mask segments.

Right click menu functions associated with mask segments

The following mask definition functions are available when you right click on a mask segment.

Mask Segments controls

Field or control Description
Triangle Sets the shape of the mask to a triangle.
Rectangle Sets the shape of the mask to a rectangle
Trapezoid Sets the shape of the mask to a trapezoid.
Hexagon Sets the shape of the mask to a hexagon.
Custom Sets the shape of your choice.
Create Duplicate Creates a new segment with the same characteristics.
Configure Segment Opens the Mask Definition configuration menu for the selected segment.
Delete Segment Deletes the selected segment.
Delete All Deletes all segments associated with the mask.

Tolerance Mask controls

Field or control Description
Configure Mask Opens the Mask Definition configuration menu for the selected mask.
Delete Mask Deletes the selected mask.

Mask Test badge configuration menu

Use the Mask Test badge menu to edit the settings of a mask test and define the actions to be taken according to the results.

To open the Mask Test badge configuration menu, double-tap on the badge.

A Mask Test badge is created when the first segment of a mask is defined.

Test Settings panel fields and controls

Field or control Description
Mask Test Turns the mask test On or Off.
Mask Display Turns the mask display On (default) or Off.
Label The text field to add a label to the mask test badge. By default, this field is blank.

When you recall a mask from a file, the name of the file is automatically displayed in the label field.

Source Lists the valid source signals for mask testing. Valid sources do not include other sources that are already being used in mask tests.
Show segment hits in badge A checkbox to display the hits on each segment in the badge. By default, the setting is unchecked.
Number of Waveforms The numeric field to define the number of waveforms to test against. This value is shared amongst all mask tests. Changing the value in one badge changes it in all mask test badges.

This field can be used along with the Single / Seq Stops After control to run a mask test with 100 waveforms ten times.

Total Failures The numeric field to set the failure threshold in number of acquisitions. The value must be greater than or equal to Consecutive Failures.
Consecutive FailuresThe numeric field to set the failure threshold in number of consecutively failing acquisitions. The value must be less than or equal to Total Failures.
Act on Event Tap the Act on Event button to configure the actions the instrument must take when a Mask event occurs (Pass, Fail, or Hits). See Act On Event configuration menu for the available fields and controls.

Mask Test badge right click menu

See Right click menu functions associated with the Mask Test badge.

Right click menu functions associated with the Mask Test badge

The following functions are available when you right click on a mask test badge.

Field or control Description
Configure Mask Test Opens the Mask Test badge configuration menu for the selected badge.
Delete Mask Test Deletes the selected mask test badge.

Math configuration menu overview

Math waveforms are created by combining and/or mathematically transforming source waveforms into a new waveform for analysis. Use this menu to create math waveforms (basic or advanced) or add an FFT (Fast Fourier Transform) waveform to the screen.

To access a Math configuration menu, double-tap a Math waveform badge on the Settings bar. If no Math badge is present, tap the Math Ref Bus > Add New Math button to add a Math waveform and open the configuration menu.

Use the following links to access information on the Math waveform menus and settings.

Math configuration menu

Equation Editor (Math configuration menu)

Math configuration menu

Use this menu to set math waveform parameters, create basic and advanced math waveforms, or add an FFT (Fast Fourier Transformation) plot to analyze frequency components of a waveform.

To access the Math menu, double-tap a Math waveform badge. If no Math badge is present, tap the Math Ref Bus > Add New Math button to add a math waveform and open the menu.

Math configuration menu fields and controls

Field or control Description
Display Turns the math waveform or FFT plot On or Off.
Vertical Scale Sets the vertical graticule scale units. Tap the arrows to change the value, tap and use the assigned multipurpose knob to change values, or double-tap to open the virtual keypad to enter a specific value.

Available when Auto Scale is disabled (unchecked) and Math Type is Basic or Advanced.

Auto Scale Toggles Auto Scale mode on or off. Auto Scale calculates the vertical scale and position to center and display the entire waveform.

Available when Math Type is Basic or Advanced.

Label Enter a label for the math waveform.
Position Sets the vertical position of the math waveform.

Available when Math Type is Basic or Advanced.

Set to 0 Sets the vertical position of the math waveform to zero (vertical center of a slice (Stacked mode) or the screen (Overlay mode).

Available when Math Type is Basic or Advanced.

Alternate Units Sets user-specified units to display on vertical scale readouts and measurement badges.
Average Toggles averaging the waveform On and Off. Use averaging to reduce noise on the waveform.
Number of Averages Sets the number of waveform acquisitions to average. Tap and use the assigned multipurpose knob to set the value.

Available when Average is On.

Math Type Sets the type of math waveform to display.

Basic creates a math waveform by adding, subtracting, multiplying, or dividing two analog waveforms.

FFT opens an FFT view of the specified signal to display the frequency components of that signal. Double-tap on the FFT view to open its configuration menu.

Advanced displays a drop-down from which to select the 20 last-accessed equations created by the Equation Editor. This mode also provides access to the Equation Editor. See Equation Editor (Math configuration menu).

Source, Source1, Source 2 Defines the signal source or sources for a Basic, FFT math waveform.

Available when Math Type is Basic, FFT.

Basic math operation list Located between the Source 1 and Source 2 fields. A drop-down list to select a basic math operation (add, subtract, multiply, divide) to apply to the two sources.

Available when Math Type is Basic.

InterpolationSelect to display the record points between the sampled points. Default is unchecked. Available when Math Type is Basic and Source 1 is Bus. Interpolation uses Sin(x)/x method.

Sin(x)/x connects using a Sin(x)/x curve between the computed values. This makes the gain or phase curve smoother than linear interpolation.

FieldSelect the field for the selected bus. Default is Data. Available when Math Type is Basic and Source 1 is Bus.
Signed DataSets the data as signed decimal. Default is unchecked.
Math n = Lists the last-accessed advanced equation. Tap the down arrow to display a list of the last-accessed equations (up to a maximum of 20) created by the Equation Editor. Select an equation to display that math waveform.

Tap Edit to open the Equation Editor to edit the displayed equation. You can also double-tap on an equation in this field and directly edit the equation using the virtual keyboard. See Equation Editor (Math configuration menu).

Available when Math Type is Advanced.

Edit Opens the Equation Editor to create advanced math waveforms from analog channels, reference, math waveform, measurement, and variable sources.

Tap the Edit button to open the Equation Editor. See Equation Editor (Math configuration menu).

Available when Math Type is Advanced.

Math waveform guidelines

  • You can take measurements on math waveforms in the same way as on channel waveforms.
  • Math waveforms derive their horizontal scale and position from the sources in their math expressions. Adjusting these controls for the source waveforms also adjusts the math waveform.
  • You can Zoom on math waveforms.

Equation Editor (Math configuration menu)

Use the Equation Editor to build your advanced math waveform expression using sources, operators, constants, measurements, and functions.

To access the math Equation Editor:
  1. Double-tap a Math waveform badge. If no Math badge is present, tap the Math Ref Bus > Add New Math on the Setting bar to add a Math waveform and open the configuration menu.
  2. Set Math Type to Advanced.
  3. Tap Edit to open the Equation Editor.

Equation Editor menu fields and controls

Field or control Description
Sources Lists all available sources that you can add to an equation. Tap a source icon to add it to the cursor position in the Math x = input box. Drag the sources field up or down to scroll through selections.

If a source column is empty, there are no active or defined sources for that category.

Functions Select the math functions to apply to your signal or signals. See Add Functions (math Equation Editor).
Keypad Use to enter numeric, basic math operations, and logic conditions.
Math <x> = The field that lists the equation components that you add with the equation controls for the numbered Math waveform. You can also directly edit this field.
Clear Clears the math equation field.
Arrows Use to move the cursor position in the Math <x> = equation field.
SpaceUse to add the space to the right of the cursor.
Delete Deletes the selected part of the equation (recommend that you use a mouse to more easily select equation text).
Backspace Deletes the character to the left of the cursor.
Apply Tap to apply the math expression shown in the Math <x> = field and display the math waveform. The first ~ eight characters of the equation also appears in the Math badge on the Settings bar.

When the editor detects a logic or syntax error with the equation, the editor displays an error message, along with the character position in the equation where the editor considers the error to have occurred.

Cancel Closes the editor menu, does not update the equation list if you made any changes from the last time you Applied or OK'd an equation.
OK Applies the equation to the math waveform, closed the Advanced Editor window, and adds the equation to the available equation list.

Equation editor guidelines

  • Math definitions are not applied if the sources are not valid.
  • Syntax or other equation or source errors display a short error message on the Math configuration menu.
  • Use parentheses to group terms in the expression to control execution order, for example, 5*(Ch1 + Ch2).

Add Functions (math Equation Editor)

Use the Add Functions controls to add predefined math operations to your math waveform equation.

Button Description
Integral. Inserts the text INTG( into the math expression. Enter an argument to the function. The integral function produces the integral of the argument.
Base 10 logarithm. Inserts the text LOG( into the math expression. Enter an argument to the function. The log function produces the base 10 logarithm of the argument.
Square root. Inserts the text SQRT( into the math expression. Enter an argument to the function.
Absolute. Inserts the text FABS( into the math expression. The FABS function takes the absolute value of the expression.
Derivative. Inserts the text DIFF( into the math expression. Enter an argument to the function. The derivative function produces the derivative of the argument.


Natural logarithm. Inserts the text LN( into the math expression. The natural logarithm function produces the natural logarithm of the argument.
Natural antilog. Inserts the text EXP( into the math expression. The EXP function produces the natural antilog of the argument.
FFT Magnitude. Inserts the text FftMag( into the math expression. Select one of the waveforms as an argument to the function. This function creates an FFT waveform that shows the magnitude components of the source signal.

Menu bar overview

The Menu bar provides access to file, utility, and help functions.

The Menu bar

Field or control Description
File Provides typical system file management operations such as opening, saving, moving, and renaming files. See the links after this table for more information.

See Recall configuration menu (File menu).

Save saves current waveform, session, or setup file.

See Save As configuration menu (File menu).

See File Utilities configuration (File menu).

Default Setup immediately restores the oscilloscope to factory default settings.

Edit Provides a menu to Undo or Redo the last operation. See the links after this table for more information.

See Undo, Redo (Edit menu).

Utility Use to set user preferences, configure input, output, and network settings, run self tests, verify calibration status and run signal path compensation, and erase nonvolatile memory. See the links after this table for more information.

See Calibration configuration menu (Utility menu).

See Security configuration menu for standard instruments (Utility menu).

Help Opens the Help viewer, displays current instrument software, See the links below for more information.

See Help... (Help menu).

See About (Help menu).

Sample (Acqs) Displays the number of waveform acquired and the number of acquisition for the Acq modes.
Battery indicatorDisplays the battery charging for the battery supported models.

Recall configuration menu (File menu)

Use this menu to recall (load) reference waveforms, instrument setups, mask settings, and sessions (setup plus waveforms). The supported file formats are .wfm, .trc, .isf, .tr0, .wfmx, .set, .tss, .msk, .xml, .bin, and .csv.

Recall the file using Recall configuration menu. Use below procedure to open Recall configuration menu.
  1. Tap File on the menu bar.
  2. Tap Recall to open the Recall configuration menu.

Recall configuration menu fields and controls

Field or control Description
Look in: Shows the current directory path to the location of a file.

Tap on the file path and use a keyboard to enter a new save location. Or double-tap on the file name to open the virtual keyboard and enter a path.

Tap the down arrow icon on the right end of the field to open a list of recent file save locations, up to a maximum of 20 locations.

File type to open (tabs) Tabs on the left let you set which type of file to recall (Waveform, Setup, Mask, or Session).

Selecting a file type sets the file extensions in the Files of Type field to the correct value.

The Drive column lists the directory structure, opening at the root (/) level. Use to quickly navigate to a location.

Tap to list the contents of the directory in the Name pane.

Double-tap an item to display the directory and any subdirectories under it. Double-tap again to close that directory structure.

Drag the list up and down to show more entries.

File/Folders list viewList all files or folder for currently selected directory. List view displays more details about file, folder such as Name, Size, Modifed date and time, Type, etc.

The image file formats supported for are .PNG, .JPG, and .BMP.

Use the arrow buttons to navigate the file directory.

The left arrow navigates back to the previously visited folder.

The Right arrow navigates forward to the previously visited folder.

The Up arrow navigates up one level from the current folder.

Use to create a new directory (folder) at the current location. Opens the new directory after it is created.
File name Lists the selected file name.
Files of type Use to select the file format you want to open. The drop-down list shows all file extension types that the instrument can read for the selected file type.
Cancel Cancels the file open action and closes the configuration menu.
Recall Recalls the selected file.

Recalling a waveform file adds a Reference waveform badge to the Settings bar and displays the waveform as it fits in the current Horizontal setting.

Recalling a Setup or Session immediately sets the oscilloscope to the settings in the file and displays any waveforms that were part of the recalled session.

Save As configuration menu (File menu)

Use this menu to configure saving screen captures, waveforms, oscilloscope setups, reports, and session files.

To access the Save As configuration menu, tap File on the menu bar and select Save As....
Note:Selecting File > Save the first time after powering up the oscilloscope opens the Save As configuration menu. This lets you set or verify the save locations for all types of information you can save.

Once the Save As configuration menu has been opened and closed, the next time you select Save causes the instrument to automatically save the file type last selected in the Save As configuration menu. This lets you quickly save files with a simple menu selection.

Save As configuration menu fields and controls

The following fields and controls are common to all Save As actions.

Field or control Description
File save type Tabs on the left let you set which type of file to save (Screen Capture, Waveform, Setup, Report, or Session). Selecting a file type sets the file extensions in the Save As Type field to the correct value.
Save Location Lists the location where the file will be saved. The default value is the last location to which a file was saved.

Tap on the file path and use a keyboard to enter a new save location. Or double-tap on the file name to open the virtual keyboard and enter a path.

Tap the down arrow icon on the right end of the field to open a list of recent file save locations for the current save type.

Browse Tap to open the Browse Save As Location configuration menu, to navigate to and select the location to which to save the file. See Browse Save As Location configuration menu .
File Name The file name assigned to the file. The default value is either the user-entered name used to last save this file type, or a numeric value calculated by the instrument if this file type has not previously been saved with a custom file name. The default value is Tek000.

Tap the down arrow on the right edge of the field to display and select from a list of recently-saved file names.

Tap on the file name and use a keyboard to enter a new file name. Or double-tap on the file name to open the virtual keyboard and enter a file name.

Auto Increment File Name Select to enable auto-incrementing of the file name. Auto increment adds a number count to the end of the file name, and increments it on each subsequent saving of the same file name.
Count Sets the increment count start number. Default is 000.
Save As Type Lists the available formats to which you can save files. The available save formats are set by the type of file being saved.

Tap the field and select the save format.

Cancel Cancels the file save action and closes the configuration menu.
OK Saves the file to the specified location, closes the Save As configuration menu, and displays a confirmation message.

Screen Capture tab fields and controls

The following settings are specific for saving a screen capture

Field or control Description
File save type Tap the Screen Capture tab to save a screen image to a file. Selecting Screen Capture sets the file extensions in the Save As Type field to available graphic file formats.
Save As Type Lists the available formats to which you can save files. The available save formats are set by the type of file being saved.

Tap the field and select the graphic save format.

To save screen captures with waveforms on a white background, tap Utility>User Preferences and set Screen Capture Colors to Inverted. When you save the next screen capture, the display inverts colors for just a moment, saves the displayed image to the file, and returns the screen to normal colors. This capability us useful to save ink on printouts of screen captures. See the Display panel settings in User Preferences (Utility menu).

Waveform tab fields and controls

The following settings are specific for saving a waveform.

Field or control Description
File save type Tap the Waveform tab to save waveform(s) to a file. Selecting Waveform sets the file extensions in the Save As Type field to available waveform file formats.
Save As Type Lists the available formats to which you can save files. The available save formats are set by the type of file being saved.

Tap the field and select the graphic save format.

Source Sets the waveform source to save. You can save a single waveform, or save all active (displayed) waveforms.

Waveform file names include the source channel or waveform appended to the end of the file name.

Display as next available Ref waveform Sets the waveform to be saved and automatically opened (displayed) as the next available reference waveform. It doesn't matter what type of file is saved, that waveform will be opened as a Ref waveform. If gating is in use, a smaller, gated waveform is saved and displayed.

This control is not present when source is set to All.

Gating Sets the method to save a specified part of the waveform data.

None saves the full waveform data (default).

Cursors saves the waveform data located between the vertical cursors. If cursors aren't on when selecting cursor gating, the cursors are activated.

Screen saves the waveform data that is on the screen.

Resample saves the waveform data at a sample interval set by the user. The resulting saved waveform is a resampled version of the original waveform with fewer data points.

Gating notes:

  • Default Setup restores Gated Save to its default setting (None).
  • The state of Gated Save gets saved in Setup and Session files.
  • Gated saves do not work on plot waveform data.
  • Gating cannot be used to save waveform data while in Fast Frame mode.

Setup tab fields and controls

The following settings are specific for saving an instrument setup.

Field or control Description
File save type Tap the Setup tab to save the instrument setup and measurement settings to a file. Selecting Setup sets the file extension in the Save As Type field to .set.
Include Reference Waveforms Include the instrument waveforms.

Report tab fields and controls

The following settings are specific for saving an instrument report.

A report can include information on instrument settings, measurement results, screen images, individual measurement configuration, source input settings, and error and warning information for measurements. Reports are either a PDF file or a single file Web page.

Field or control Description
File save type Tap the Report tab to save a report file. Selecting Report sets the file extensions in the Save as Type field to available report file formats.
Save As Type Lists the available formats to which you can save files. The available save formats are set by the type of file being saved.

Tap the field and select the report save format (PDF or Single File Web Pages).

Append Report Appends a report to an existing report file.
Comments Add comments to clarify the contents or purpose of the report, or specifics of the signals being measured.
Include Images and Annotations Add Waveform and Plot images to the report.
Include Setup Configuration Add instrument and measurement configuration information to the report.

Session tab fields and controls

The following settings are specific for saving an instrument session.

A session is a zipped file that contains an instrument setup file and all acquired waveform data. Use session file contents to move analysis activities to a PC and free up the instrument for others to use.

Field or control Description
File save type Tap the Session tab to enable saving a session file. Selecting Session sets the file extensions in the Save As Type field to .tss.
Save As Type A session file can only be saved to format .tss.

Browse Save As Location configuration menu

Use this menu to select a new file location to save files.

To access the Browse Save As Location configuration menu:
  1. Select File > Save As....
  2. In the Save As configuration menu, tap the Browse button.

Browse Save As Location configuration menu fields and controls

Field or control Description
File path field Shows the current directory.

Tap on the file path and use a keyboard to enter a new path. Or double-tap on the file name to open the virtual keyboard and enter a path.

Tap the down arrow icon on the right end of the field to open a list of recently accessed file save paths, for the current save type, up to a maximum of 20 paths.

The Drive column lists the directory structure, opening at the root level. Use to quickly navigate to a location.

Tap to list the contents of the directory in the Name pane.

Double-tap an item, or tap the small arrow to the left of the directory, to display the subdirectories under it. Double-tap again to close that directory structure.

Drag the list up and down to show more entries.

Use the arrow buttons to navigate the file directory.

The left arrow navigates back to the previously visited folder.

The Right arrow navigates forward to the previously visited folder.

The Up arrow navigates up one level from the current folder.

Use to create a new directory (folder) at the current location. Opens the new directory after it is created.
Cancel Cancels the file path change, closes the configuration menu, and returns to the Save As configuration menu. No file path change occurs.
OK Closes the configuration menu, returns to the Save As configuration menu, and updates the Save Location field with the path from the Browse configuration menu.

File Utilities configuration (File menu)

Use this menu to copy, paste, delete, and rename files, and unmount memory devices from USB ports.

To access the File Utilities configuration menu, select File > File Utilities from the Menu bar.

File Utilities configuration menu fields and controls

Field or control Description
File path field Shows the current directory.

Tap on the file path and use a keyboard to enter a new save location. Or double-tap on the file name to open the virtual keyboard and enter a path.

Tap the down arrow icon on the right end of the field to open a list of recent file save locations, for the current save type, up to a maximum of 20 locations.

The Drive column lists the directory structure, opening at the root level. Use to quickly navigate to a location.

Tap to list the contents of the directory in the Name pane.

Double-tap an item to display the directory and any subdirectories under it. Double-tap again to close that directory structure.

Drag the list up and down to show more entries.

File/Folders list viewList all files or folder for currently selected directory. List view displays more details about file, folder such as Name, Size, Modifed date and time, Type, etc.

The image file formats supported for are .PNG, .JPG, and .BMP.

Double-tap the report file to open in a separate window. The supported formats are .MHT and .PDF. Use left/right arrow to navigate to the previous/next report.

Use the arrow buttons to navigate the file directory.

The left arrow navigates back to the previously visited folder.

The Right arrow navigates forward to the previously visited folder.

The Up arrow navigates up one level from the current folder.

Use to create a new directory (folder) at the current location. Opens the new directory after it is created.
Copy Copies the selected file in the filename pane to memory. You can copy the Tek files or folders from local/network/USB drives or from TekDrive file storage location.
Paste Pastes the file from the last Copy action in the current File Utilities session into the current location. You can paste the Tek files or folders to the chosen file target location. The target locations are local/network/USB drives or TekDrive file storage location as well.
Delete Deletes the selected file or folder.
Rename Renames the selected file or folder.
Unmount Unmount the selected drive. Select the drive letter and tap Unmount.

For USB drives, Unmount closes the file writing session on the attached USB device to let you disconnect the device from the USB port. The device is also removed from the Drive column of menus that can access drives.

For network drives, Unmount removes the network drive connection information from the instrument. The network drive is also removed from the Drive column of menus that can access drives.

For TekDrive, Unmount removes the TekDrive connection information from the instrument. The TekDrive is also removed from the Drive column of menus that can access drives.

Mount Drive configuration menu

Use this menu to connect to a network or TekDrive. The network menu applies to base instrument only (instrument that do not have the Windows 10 OS SSD option installed) and TekDrive menu applies to all the platforms.

To open the Mount Drive menu:

  1. Select File > File Utilities from the Menu bar.
  2. Tap Mount to open the Mount Drive menu.

Mount Drive configuration menu fields and controls

Field or control Description
Drive TypeSelect the required drive to mount on your instrument.
  • Network
  • TekDrive
Network
Drive Letter Shows the current list of available (unassigned) drive letters. Tap on the list and select a drive letter to assign to the network drive.
Specify Server Sets how you specify the server location; by server Name or IP address.
Server Name The server name is associated with the remote drive. Double-tap the field and enter the server name.
Server IP Address The IP address of the server. Tap the field and enter the network drive's IP address.
Path The path to the network drive. Double-tap the field and enter the network drive path information.
User Name If the drive you are mounting is password-protected, use this field to enter the user name associated with the drive. Double-tap the field and enter the user name.
Password If the drive you are mounting is password-protected, use this field to enter the password associated with the drive. Double-tap the field and enter the password.
Domain/WorkgroupSets the Domain/Workgroup of the intranet for the network drive.
Verbose Tap the Verbose checkbox to get more information in the log file. Default is unchecked.
Cancel Closes the menu without taking any action.
OK Submits the drive access information to the network drive server. If successful, the menu is dismissed, a confirmation message is displayed, and the drive is added to the Drive column of file menus that access drives.

If not successful, the menu remains on screen and an error message is displayed. Use the error message to resolve the login problem.

TekDrive
Drive NameEnter the required drive name for mounting.
Auto DisconnectSelect to configure the duration for the TekDrive connection to be active for usage.
  • PowerCycle: Select to unmount the TekDrive after power cycling the oscilloscope. There is no time restriction when this option is chosen.
  • Never: Select to mount the TekDrive connection permanently.
  • Custom: Select to disconnect the TekDrive after a chosen duration.
The default selected is PowerCycle.
Time Enter the required time for the Auto Disconnect. The mounted TekDrives gets disconnected automatically from the instrument after the specified time.

Available only when Auto Disconnect = Custom.

Restrict connection to current IP AddressSelect to enable the restriction of connection to the current IP address. This is performed for security purposes.

Enabled checkbox setting is recommended.

When the checkbox is disabled, the application displays the error: "This setting is recommended, because it restricts TekDrive access to the current public IP Address making your data secure and inaccessible if the device moves to a new network location."

Connect to TekDriveSelect to confirm all the configured settings and connect to the TekDrive.
Code activation controls
CancelSelect to close the menu without performing any action and does not connect to the new TekDrive.
BackSelect to take you to the previous menu giving an opportunity before connection, to reconfigure all the input control settings to connect to the TekDrive.
OK, Mount TekDrive Select to confirm the configuration to complete the TekDrive mounting.

This will make sure all the file browsers in the application show the connected TekDrives in it for saving or recalling files to TekDrive.

Undo, Redo (Edit menu)

The Edit menu lets you Undo or Redo recent actions. Tap Undo or Redo. Not all oscilloscope actions can be undone. If the Undo or Redo menu items are grayed out, then the last action cannot be undone or redone.

User Preferences (Utility menu)

Use this menu to set global display, Autoset, custom waveform colors, and other user preferences.

To open the User Preferences menu:

  1. Tap Utility menu.
  2. Tap User Preferences to open the configuration menu.
  3. Tap a panel.

Display panel fields and controls

Field or control Description
Default Waveform View Display Mode Sets the default waveform view display mode, either Overlay or Stacked.
Waveform View Graticule Sets the graticules to be Movable or Fixed for both stacked and overlay modes.

Movable (default) sets graticules to move along with waveforms, and displays graticule units.

Fixed sets graticules so that they do not move when you change a waveform's vertical or horizontal position. Fixed graticule mode also does not display the Vertical and Horizontal graticule labels. Use Cursors to take on-screen measurements.

Displayed Colors Tap and select either Normal or Inverted colors to set how the instrument displays waveforms and plots.

Normal shows waveforms and plots in color with a back background.

Inverted makes the waveform background white, with graticule markings in black. Inverted does not change the Menu bar, Results bar, or Settings bar colors. Use this setting to save ink on printed screen captures.

Define Custom Colors Opens the Define Custom Colors menu. This menu lets you change channel, math, and reference waveform colors for both Normal and Inverted display modes.
Screen Capture Colors Sets how the instrument saves screen images (Normal or Inverted colors).

Normal saves waveforms and plots in the colors as shown on the screen.

Inverted makes the waveform background white, with graticule marking in black, just for screen saves. Inverted does not change the Menu bar, Results bar, or Settings bar colors. Also, if Displayed Colors is set to Inverted, selecting Inverted for screen saves does not invert the colors back to normal for the screen save; to save normal colors for a screen save, select Normal.

Backlight Sets the intensity of the backlight.
Auto-Dim Select On to automatically dim the screen backlight after a specified time.
Time Sets the amount of time to wait before the display is dimmed. Tap in the field and use the knob to change the time value, or double-tap to open the virtual keypad and set a time value.

Available when Auto-Dim is On.

Autoset panel fields and controls

Field or control Description
Autoset Adjusts Selects which controls to change as part of the Autoset operation (Vertical Settings, Horizontal Settings, Trigger Settings, and Acquisition Settings). The default is for all adjustments to be enabled.
Autoset in Overlay Display Mode Optimizes Sets whether to optimize waveform resolution or visibility when doing an Autoset while in the Overlay display mode.

Resolution uses as much of the ADC's range as possible to provide the best vertical resolution and measurement accuracy, but waveforms will overlap each other.

Visibility scales and positions waveforms so they are visually separated from each other at the expense of vertical resolution and measurement accuracy.

Autoset guidelines

  • Autoset uses the current trigger source as its reference for various operations such as setting horizontal scale.
  • If the current trigger type is Bus or Sequence, or if trigger type is Edge and the trigger source is AC Line, Autoset uses the lowest-numbered active channel as its reference.
  • Autoset changes the acquisition mode to Sample.
  • Doing a Default Setup operation does not change Autoset panel settings.
  • All analysis and measurements abort immediately when an Autoset is started, and then restart upon Autoset completion.

Measurements panel fields and controls

Field or control Description
Shared Reference Levels Tap to select either Global or Per Source reference levels.

Global applies the same reference levels to all measurement sources.

Per Source allows selection of a different reference levels for all measurement sources.

Calculate Reference Levels Tap to select how often to calculate reference levels.

First Acq only calculates the reference levels on the first acquisition and re-uses them for all subsequent acquisitions. Pushing the Clear front-panel button, or making measurement changes (adding, deleting, or reconfiguring) also clears the reference levels which are then recalculated on the next acquisition.

Every Acq calculates the reference levels with every acquisition.

Measurement Interpolation Interpolation defines how the waveform is drawn between waveform record data points. Tap and select the measurement interpolation method.

Auto selects the best interpolation method.

Sin(x)/x interpolation computes record points using a curve fit between the actual samples acquired.

Linear interpolation computes record points between actual acquired samples by using a straight line fit.

Measurement Annotations Annotations show the exact segments of the waveform from where the chosen measurements are taken. It is a visual aid to debug the signals. There are various markers which denote the measurement annotations such as horizontal bars, vertical bars, triangles (or carets), or arrows.

Auto sets annotations to display if valid for the measurement. To view annotations for a measurement, select that measurement badge. If annotations are valid for that measurement, they are added to the waveform source for that measurement.

Off turns off display of measurement annotations.

The measurement annotations feature is supported on 4B/5/5B/6/6B Series MSO but not supported on 4 Series MSO.

Other panel fields and controls

Field or control Description
Language Enables displaying the user interface and Embedded Help files in an available language. Tap the field and select the language. The user interface changes immediately to the specified language.
Note:Not all UI terms or Help topics may be translated for new UI or menu items at the time of a firmware release. These items will be translated for a future firmware release.
Note:The Embedded Help files support English, Japanese, Simplified Chinese, and Russian. All other language selections will display the Help topics in English.
Font Size Sets the font size for UI text elements. Font size range is 12 to 19.
Right Clicks via Touch Turns On or Off the ability to use touch and hold method to open right-click menus on badges and other screen items.
Time Sets the time it takes to respond to a touch and hold before opening a right-click menu.
Programmatic Interface Backward Compatibility Allows you to choose an XML file that ensures backward compatibility of the commands defined in the XML file.

Toggle button turns On or Off the backward compatibility option. Default is Off.

Load Tap to select the XML file. You can navigate to TekDrive to load XML file.

Appears when Programmatic Interface Backward Compatibility is On.

Connected Scope Preferences Enables the connected oscilloscope with additional capabilities and improves the overall experience while using the oscilloscope.
Note:The oscilloscope should be connected to the Internet.
Oscilloscope tracks feature usage to help reproduce and fix software bugs. User identifiable information, waveform data, analysis results or screenshots are never saved Enables oscilloscope tracks feature usage to help reproduce and fix software bugs. It will not save user-identifiable information, waveform data, analysis results or screen shots.

Connected Oscilloscope preferences

Use the Connected Oscilloscope preferences to make you more efficient and improve the overall user experience while using the oscilloscope (2 Series MSO).

When enabled it provides additional capabilities which improves the overall experience while using the oscilloscope. Whenever the status of checkbox changes it is shared with Tektronix.

Note:Enabling this checkbox does not send any information that is used to identify a specific company or individual.

Tektronix will not send any information to the oscilloscope unless you enable Oscilloscope tracks feature usage to help reproduce and fix software bugs. User identifiable information, waveform data, analysis results or screenshots are never saved.

When this option is enabled, the oscilloscope will record information about the instrument and its usage. The information includes actions taken in the user or programming interfaces, the model number of the scope, its firmware version, and information about installed options or probe attachments. This information does not include anything that is used to identify a specific company or individual.

This information is stored in a text file on the instrument and is viewed with any text viewing program. Disabling this feature will delete the file. If the instrument is connected to a network while this feature is enabled, this information will be periodically sent to Tektronix.

By enabling this option you agree that the software records anonymous information about the usage of this instrument, and periodically send it to Tektronix.

Tap Legalese to view legal information within the legal framework.

Tap Save Preferences will save the selected preferences.

Tap Cancel to discard the changes.

Legalese

Tap the Legalese button to view the legal information and details of the functionalities enabled when you check the boxes in the previous dialog (Connected Scope Preferences).

To open the Legalese dialog, select Utility > User Preferences > Other > Connected Scope Preferences > Legalese.

Enabled Connected Scope

When the check box is enabled in Connected Scope Preferences dialog: You agree that the software may contact Tektronix servers periodically. You also agree that the instruments model and serial number and status of the enabled check boxes will be sent to Tektronix.

Oscilloscope tracks feature usage to help reproduce and fix software bugs

When the check box is enabled in Connected Scope Preferences dialog: You agree that the software may record anonymous usage information about this instrument and send it to Tektronix. You also agree that the instruments model and serial number and status of the enabled check boxes will be sent to Tektronix.

Define Custom Colors menu

Use this menu to change the colors used to display channel, math, and reference waveforms in the Waveform view. You can set custom waveform colors for both Normal and Inverted display modes.

To open the Define Custom Colors menu:

  1. Tap Utility > User Preferences to open the configuration menu.
  2. Tap Define Custom Colors in the Display panel.

Define Custom Colors menu fields and controls

Field or control Description
Normal Display Colors Use this menu to change the waveform colors to use when the instrument is in Normal display mode.

Channels sets the colors used to display instrument channels.

Maths sets the colors used to display math waveforms.

Refs sets the colors used to display reference waveforms.

To change a color, tap a channel, math, or reference color to open a color menu and select a new color. The waveform immediately changes to the selected color if the display is in Normal mode. The color menu stays open to let you experiment with different waveform colors. Tap outside the color menu to close it.

Inverted Display Colors Use this menu to change the waveform colors to use when the instrument is in Inverted display mode.

Channels sets the colors used to display instrument channels.

Maths sets the colors used to display math waveforms.

Refs sets the colors used to display reference waveforms.

To change a color, tap a channel, math, or reference color to open a color menu and select a new color. The waveform immediately changes to the selected color if the display is in Inverted mode. The color menu stays open to let you experiment with different waveform colors. Tap outside the color menu to close it.

The colors for Math waveforms 1-8 are reused for Math waveforms 9-16, 17-24, and so on.

The colors for Ref waveforms 1-8 are reused for Ref waveforms 9-16, 17-24, and so on.

Set All Normal Display Colors to Default Sets all Normal display mode waveform colors to their factory default settings.
Set All Inverted Display Colors to Default Sets all Inverted display mode waveform colors to their factory default settings.

Custom waveform color guidelines

  • There are 48 colors from which to choose.
  • There are no restrictions on assigning colors. You can assign different colors to different waveforms, or the same color to many waveforms.
  • Changing a waveform color automatically changes all indicators that use that waveform's color (channel handles, vertical scale readout, signal badges, measurement badges, front-panel control LED colors, and so on).
  • Waveform color settings are saved as part of waveform, setup, and session save actions.
  • You cannot change Bus waveform colors.

I/O (Utility menu)

Use this configuration menu to set up a LAN, USB Device Port, Socket Server, and AUX OUT signal parameters.

To open the I/O menu:

  1. Tap the Utility menu.
  2. Tap I/O....

Entering and applying LAN network changes

When first opening the I/O menu LAN panel, the Network Address is set to Auto (default setting) and the Apply Changes button is grayed out (inactive) in the LAN panel.

When you select any editable input box and start entering data, the Apply Changes button becomes active, and the characters being entered are bolded and italicized. Bold italicized text means that the values have not been applied to the oscilloscope settings.

When you tap the Apply Changes button, all changes are saved (takes about 10 seconds), the text is changed to normal font (nonbold, nonitalic), and the Apply Changes button becomes inactive.

If you tap outside the I/O menu before you tap the Apply Changes button, the menu closes and none of your changes are saved.

LAN panel fields and controls

Field or control Description
LAN Status A readout that indicates the status of the LAN connection, either a Green circle with the word Normal or a Red circle with an error message.
Host Name The instrument host name is displayed. To change the name, double-tap and enter a name in the virtual keyboard.
Network Address Tap to select Manual or Automatic mode. In Automatic mode, the current Instrument IP Address, Gateway IP Address, Subnet Mask, and DNS IP Address are displayed.
Domain Name The instrument domain name is displayed. To change the name, double-tap and enter a name in the virtual keyboard.
Instrument IP Address Tap and use the multipurpose knobs to enter the address. Use the A knob to select the digit, and the B knob to change the value.

Available to edit when Network Address is Manual.

Subnet Mask Tap and use the multipurpose knobs to enter the mask. Use the A knob to select the digit, and the B knob to change the value.

Available to edit when Network Address is Manual.

Service Name The instrument service name is displayed. To change the name, double-tap and enter a name in the virtual keyboard.
Gateway IP Address Tap and use the multipurpose knobs to enter the address. Use the A knob to select the digit, and the B knob to change the value.

Available to edit when Network Address is Manual.

DNS IP Address Tap and use the multipurpose knobs to enter the address. Use the A knob to select the digit, and the B knob to change the value.

Available to edit when Network Address is Manual.

MAC Address A readout of the instrument MAC Address. This field is not editable.
Test Connection Tap to test the connection. If the connection test is successful, then OK is displayed. If the test is unsuccessful, then No Response is displayed.
LAN Reset Tap to display the LAN Reset configuration menu (Utility > I/O menu).
Apply Changes Apply changes made on this panel to the instrument.
Note:No changes are made to instrument settings until you tap the Apply Changes button.

USB Device Port fields and controls

Use the USB Device Port panel to enable or disable USB ports. Use USB ports to connect a USB memory device, keyboard, or for direct PC control of the oscilloscope using USBTMC protocol.

Field or control Description
USB Device Port Tap to toggle all USB device ports On or Off.
USBTMC Configuration Displays the USBTMC configuration information.

Socket Server panel fields or controls

Use the following socket server settings to set up and use a socket server between your oscilloscope and a remote terminal or computer.

Field or control Description
Socket Server Tap to toggle the socket server On or Off.
Protocol Tap to select a protocol, either None or Terminal.

A communication session run by a user at a keyboard typically uses a terminal protocol. An automated session might handle its own communications without such protocol from the oscilloscope.

Port Enter the port number using the multipurpose knob or virtual keypad.

AUX Out panel fields and controls

Use the following settings to select the signal that is output on the rear-panel AUX Out signal connector.

Field or control Description
AUX Out Signal Sets the trigger output On or Off to send the signal to the AUX Out connector.
Polarity Tap to select the polarity of the trigger signal (positive or negative pulse per trigger event). The polarity control is present only for the Trigger output.

VNC Server panel fields and controls

Use the following VNC Server settings to set up a VNC server and password to access your oscilloscope remotely.

Field or control Description
VNC Server Tap to toggle the VNC Server On or Off.
Password Double-tap the password fields to enter the password using virtual keyboard and tap Submit.
Remove Password Tap to remove the password for VNC Server. The instrument displays a popup message that confirms the password is removed.

Using Telnet to communicate with the oscilloscope

  1. After you have set up the socket server parameters, the computer is now ready to communicate with the oscilloscope. If you are running an MS Windows PC, you could run its default client Telnet, which has a command interface. One way to do this is by typing Telnet in the Run window. The Telnet window will open on the PC.
    Note:On MS Windows 10, you must first install Telnet.
  2. Start a terminal session between your computer and your oscilloscope by typing in an open command with the oscilloscope's LAN address and port number.

    You can obtain the LAN address by pushing the Ethernet lower menu button and the resulting LAN Settings side menu button to view the resulting Ethernet Settings screen. You can obtain the port # by pushing Socket Server on the lower menu and viewing Current Port on the side menu.

    For example, if the oscilloscope IP address was 123.45.67.89 and the port # was the default of 4000, you could open a session by writing into the MS Windows Telnet screen: o 123.45.67.89 4000.

    The oscilloscope will send a help screen to the computer when it has finished connecting.

  3. You can now type in a standard query, such as, *idn?.

    The Telnet session window will respond by displaying a character string describing your instrument.

    You can type in more queries and view more results using this Telnet session window. You can find the syntax for relevant commands, queries and related status codes in the Programmer Manual that is available at the Tektronix website.

    Note:Do not use the computer’s backspace key during an MS Windows Telnet session with the oscilloscope.

LAN Reset configuration menu (Utility > I/O menu)

Use this menu to reset the Local Area Network (LAN) settings to the listed default settings.

To open the LAN Reset dialog:

  1. Tap Utility in the Menu bar.
  2. Tap I/O... .
  3. Tap the LAN Reset button to open the LAN Reset configuration menu.
  4. Tap OK to reset the LAN settings.
  5. Tap Cancel to close the dialog without taking any action, and return to the I/O configuration menu.

LAN Reset default settings

Function Setting
Network address Automatic
DHCP Enabled
BOOTP Enabled
mDNS & DNS-SD Enabled

See also

I/O (Utility menu)

Self Test configuration menu (Utility menu)

Use this menu to view power-on diagnostic results, run extended self tests, and verify the 250 kΩ termination control works on input channels.

To open the Self Test configuration menu:

  1. Tap Utility in the Menu bar.
  2. Tap Self Test....

Tap anywhere outside of the menu to close the menu.

Note:Remove all input signals before running the extended self tests.

Self Test configuration menu fields and controls

Field or control Description
250 kΩ Verification Opens a menu to verify that 250 kΩ termination can be enabled or disabled for every channel. Closing the menu restores the normal termination setting of all connected probes.
Export Log Files Opens a menu that lets you save instrument log files to a .zip-compressed file. The log file is a valuable information resource when working with Tektronix Customer Support to troubleshoot a problem or report an issue.

You can navigate to the TekDrive location to export log files.

Power-on Self test Results Displays the power-on self test status (Passed or Failed).
Extended Self Test Results Lists the status of each Extended self tests (Passed or Failed).

If one or more tests fail at power-on, tap on Run Self Test and see if the test or tests continue to fail. If tests continue to fail, contact your nearest Tektronix Service Center for help with resolving the problem.

Run N Times Sets the number of times to run the extended self tests.
Run Self Test / Abort Self Test Tap Run Self Test to run the extended self tests. While tests are running, the button changes to Abort Self Test. When self tests are stopped, the button reverts to Run Self Test.
Note:Remove all input signals before running the extended self tests.

Tap the Abort Self Test button anytime to stop testing.

Calibration configuration menu (Utility menu)

Use this menu to perform a signal path compensation or view the factory calibration status.

To open the Calibration configuration menu:

  1. Tap Utility in the Menu bar
  2. Tap Calibration....

Calibration configuration menu fields and controls

Field or control Description
Factory Adjustment Status This area at the top of the menu lists the instrument calibration status. Factory Adjustment Status should be Calibrated.

If an instrument becomes uncalibrated, this displays an Uncalibrated status and a red Warning message bar is shown at the top of the screen in the Menu bar area. Contact your nearest Tektronix Service Center for assistance.

SPC Status Indicates the status of the last SPC run (Pass or Failed). Also indicates how long ago the last SPC was run.
Run SPC Signal path Compensation (SPC) corrects for internal DC inaccuracies caused by temperature variations and/or long-term drift in circuits.
Note:SPC takes three minutes per channel to run.

Allow the instrument to warm up for 20 minutes before running SPC.

Remove all probes, cables, and adapters from the input connectors before running SPC.

Tap Run SPC to run signal path compensation. The compensation can take up to three minutes per channel.

Security configuration menu for standard instruments (Utility menu)

If you have acquired confidential data, use TekSecure® to erase the oscilloscope memory before you return the oscilloscope to general use. This menu applies to all standard instruments that were not configured with Enhanced Security when ordered.

To run the Security process:

Note:Save any important waveform, screen capture, instrument setup, report, and session files to external memory before running TekSecure. All such files will be erased.
  1. Tap Utility in the Menu bar.
  2. Tap Security....
  3. Tap Run TekSecure to erase nonvolatile memory. It will take approximately two minutes to erase the memory.
  4. Push the Default Setup front panel button to load memory with the instrument factory settings.
Note:You cannot stop the TekSecure process once it is started.
Note:TekSecure does not erase calibration constants or instrument firmware.

TekSecure Erase Memory

Use this menu to use the TekSecure® function to erase the oscilloscope nonvolatile memory.

For instruments running on the embedded OS, TekSecure is a shortcut for overwriting the SSD from the recovery partition. For instruments running on the Windows 10 OS, TekSecure deletes files in the folder C:\Users\Public\Tektronix.

To open the Security menu and run TekSecure:

  1. Tap Utility in the Menu bar.
  2. Tap Security... .
  3. Tap Run TekSecure to run the TekSecure memory erase. It will take approximately two minutes to erase the memory.
  4. To exit the dialog without running TekSecure, tap outside of the configuration menu.

TekSecure runs for about two minutes. You cannot stop the process once it is started. Do not power down the instrument while TekSecure is running.

Note:TekSecure does not erase calibration constants or instrument firmware. Save any important waveform, screen capture, instrument setup, report, and session files to external memory before running TekSecure.

Demo (Utility menu)

Use this menu to access demonstrations of key oscilloscope features.

To open the Demo configuration menu, select Utility > Demo... in the Menu bar.

Demo menu fields and controls

Field or control Description
Demo overviewThe upper half of the menu shows the demonstration available in the selected panel.
Connection Details Tap this button to open a dialog box that shows how to connect the oscilloscope to a signal source to perform the selected demonstration.
Recall Demo Session Tap this button to load the session file for the selected demonstration.
Demo panels Each panel provides a demonstration of oscilloscope capabilities within a category. The categories are Miscellaneous and Serial Bus.

Each panel will have two or more demonstration buttons in them. Selecting a button loads the session file for the selected demonstration.

Help... (Help menu)

Tap this item to open the Help viewer. This Help viewer is similar in operation to a traditional Microsoft Windows help viewer.

License Options...(Help menu)

Use the License Options menu to view the list of possible license options along with the description about the licenses that can be installed in the oscilloscope. This aids you to select the right software licenses before purchasing.

To access this option, select License Options from the Help menu. License Options dialog is displayed that contains the possible licenses information. Tap on any tab and select a license to know about the selected license.

Select an option to view the related information about the selected option on top, next to the illustration. The related nomenclature and the recommended firmware version required is also displayed.

A small green tick appears when an option is already installed/enabled in the instrument.

About (Help menu)

Use the About configuration menu to show instrument information and installed options, and to install or uninstall analysis or feature options.

To open the About menu:
  1. Tap Help on the menu bar.
  2. Select About from the menu to open the About configuration menu.

About configuration menu fields and controls

Field or control Description
System information Provides system-related information such as model, bandwidth, serial number, Host ID, and installed firmware version. Provide this information when communicating with Tektronix to purchase option licenses or communicate with Customer Support.
Installed Options Lists installed options. Click on an item in the list to show details of the option in the Option Details area below the list.
Option Details Lists details of the option selected in the list, including license type, when the license was checked out, when it was installed on the instrument, and the date the license expires.
Remove License Opens the Location to Save the Exit Key dialog. Use this to uninstall a floating license option for use by others. You can use TekDrive to save removed license files. See Location to Save Exit Key configuration menu.
Install License Tap this button to open the Browse License Files dialog to navigate to and select an option license file to install. You can navigate to the TekDrive location to install saved license files. See Browse License Files menu (Help > About).

Location to Save Exit Key configuration menu

Use this menu to navigate to and set the location to save the option license key when you uninstall the license.

To access the Location to Save Exit Key menu:
  1. Tap Help on the menu bar.
  2. Select About from the menu.
  3. Tap a license in the list that you want to uninstall (return the license).
  4. Tap the Remove License button to open the Location to Save Exit Key configuration menu.

Location to Save Exit Key configuration menu fields and controls

Field or control Description
Look in Shows the current directory path at which to save the exit key file.

Tap on the file path and use a keyboard to enter a new path. Or double-tap on the file name to open the on-screen keyboard and enter a path.

Tap the down arrow icon on the right end of the field to open a list of recently accessed paths, up to a maximum of 20.

The Drive column lists the directory structure, opening at the root level. Installed USB memory devices are listed. Use to quickly navigate to a location.

Tap to list the contents of the directory in the Files pane.

Double-tap an item, or tap the small arrow to the left of the directory, to display the subdirectories under it. Double-tap again to close that directory structure.

Drag the list up and down to show more entries.

You can also use the files Name column to navigate to and select a folder in which to save the file.

Use the arrow buttons to navigate the directory structure.

The left arrow navigates back to the previously visited folder.

The Right arrow navigates forward to the previously visited folder.

The Up arrow navigates up one level from the current folder.

Use to create a new directory (folder) at the current location.

Opens the new directory after it is created.

File Name Lists the selected license file name to return (uninstall).

Tap the down arrow icon on the right end of the field to open a list of uninstalled license files, up to a maximum of 20.

Files of Type Use to select the file format you want to open.

Tap the field to show a list of all file extension types that the instrument can read for the selected file type. The Name field (where folder and files are listed) only lists files of the specified type.

Cancel Cancels the license uninstall process, closes the configuration menu without saving any changes that were made, and returns to the About configuration menu.
Create Closes the configuration menu and saves the license information to the specified location.

Browse License Files menu (Help > About)

Use this menu to select and install an option license file to enable new functions.

To access the Browse License Files menu:
  1. Tap Help > About... on the menu bar.
  2. Tap Install License button to open the Browse License Files configuration menu.

Browse License Files configuration menu fields and controls

Field or control Description
Look in Shows the current directory path and file name.

Tap on the file path and use a keyboard to enter a new path. Or double-tap on the file name to open the on-screen keyboard and enter a path.

Tap the down arrow icon on the right end of the field to open a list of recently accessed files, up to a maximum of 20.

The Drive column lists the directory structure, opening at the root level. Installed USB memory devices are listed. Use to quickly navigate to a location.

Tap to list the contents of the directory in the files listing.

Double-tap an item, or tap the small arrow to the left of the directory, to display the subdirectories under it. Double-tap again to close that directory structure.

Drag the list up and down to show more entries.

Use the arrow buttons to navigate the directory structure.

The left arrow navigates back to the previously visited folder.

The Right arrow navigates forward to the previously visited folder.

Use to create a new directory (folder) at the current location.

Opens the new directory after it is created.

File Name Lists the selected file name.

Tap on the file name and use a keyboard to enter a new file name. Or double-tap on the file name to open the on-screen keyboard and enter the new name.

Tap the down arrow icon on the right end of the field to open a list of recently accessed files, up to a maximum of 20.

Files of Type Use to select the file format you want to open.

Tap the field to show a list of all file extension types that the instrument can read for the selected file type. The files pane only lists files of the specified type.

Cancel Cancels the configuration menu changes, closes the menu, and returns to the prior menu without making any changes.
Open Closes the configuration menu, returns to the About configuration menu, and installs the license. Follow any instructions that may be shown during the installation.

Font Color menu (Text Settings configuration)

Use this menu to change the label color. Touch and hold on callout or label text, select Format Text in the right-click menu, and select Color to open this menu. Click on a color to change the text color.

Text Settings configuration menu (Callout and Waveform labels text)

Use this menu to change and format existing Callout or Waveform labels (font type and size, color, bold, italic, and underline).

Prerequisite: There is callout or waveform label on the screen.

To open the Text Settings configuration menu, double-tap on the Callout or Waveform label. You can also touch and hold on the Callout/label text and select Format Text from the right-click menu.

To delete a Callout or label, touch and hold on the Callout/label and select Delete from the right-click menu.

Text Settings configuration menu fields and controls

Field or control Description
Text Double-tap and enter the desired text using the virtual keyboard.
Font Tap and select the desired font from the drop-down list.
Size Tap and select the desired font size from the drop-down list.
Color Tap and select the desired font color from the color palette.
B Tap to toggle text bolding On or Off.
I Tap to toggle text italics On or Off.
U Tap to toggle text underlining On or Off.

Pattern Generator configuration menu

The pattern generator provides output of a predefined pattern up to bit rate 25 Mb/s. Choose a bit pattern manually, you can select a predefined pattern, or load a saved .csv-format pattern from storage (USB drive, a network drive, or TekDrive on instruments).

To open the Pattern Generator configuration menu:

  1. Tap the AFG PG > PG on the Settings bar. The oscilloscope shows the Pattern Generator configuration menu. You can change the PG settings while the output is Off.
  2. Tap Continuous or Burst to add the PG badge to the Settings bar.
  3. Double-tap the PG badge to open the PG menu.

Pattern Generator menu fields and controls

Field or control Description
Output Tap to toggle between Off, Continuous, or Burst.
CyclesSpecify the number of cycles in the text field. Default cycle value is 1. The minimum cycle value can be set is 1 and maximum cycles are 2000.

Available when Output is Burst.

When Output is selected as Burst, a Burst button is displayed on the PG badge. Tap the Burst button on the badge to generate the signal burst.

Pattern Definition Tap to toggle between Manual or File.
Amplitude Sets the amplitude of the pattern. For Continuous mode, you can set the amplitude as 2.5 V, 3.3 V, or 5 V. For Burst mode, set the amplitude as 5 V. The default amplitude value is 5 V.
Bit Rate Sets the bit rate using the keypad or multipurpose knob. The minimum bit rate is 1 b/s and maximum bit rate is 25 Mb/s.
Bit 3, Bit 2, Bit 1, Bit 0Sets the bit value for each bit. For Continuous mode, the available bits are High, Low, Toggle, and Hi-Z. For Burst mode, the available bits are High, Low, and Toggle.

Available when Pattern Definition is Manual.

Pattern File Shows the loaded pattern file path and name. Tap to select a pattern file from the PG memory drop-down list. The list displays the last 20 patterns files that have been loaded using the Load button.
Load Tap to open the Directory configuration menu. Find and select a pattern file to load into the PG memory. You can navigate to TekDrive to load saved pattern files.

Available when Pattern Definition is File.

Guidelines for loading a pattern file

  • Files must be loaded as .csv format.
  • Each column header in the file indicates the column of data to be generated from a corresponding pin. If there are no column headers are present, b0, b1, b2, b3 are added by default. The bits can be in any order as long as column headers are provided.
  • Any comments added must be in English.
  • If any of the data bits are missing from the file, it will not load and displays an error message.
  • The file size must be less than or equal to 4096 bytes.
    Note:The instrument displays an error message if the load file is empty, corrupted, or the file size is greater than 4096 bytes.

Plot configuration menus

Use plot configuration menus to change settings of a displayed plot. Double-tap a plot view to open its configuration menu.

Plot XY configuration menu

Use this menu to change settings of a displayed XY plot.

To open the XY plot menu, double-tap anywhere in the XY Plot view.

Settings panel (Plot XY configuration menu) fields and controls

Field or control Description
X-Axis Sets the source for the X-axis signal.
Y-Axis Sets the source for the Y-axis signal.
  • Use the vertical scale and position controls of the waveform connected to the X- and Y-axis sources to set horizontal scale and position of the XY waveform.
  • XY format is particularly useful for studying phase relationships between two similar signals, creating Lissajous Patterns.
  • XY format is a dot-only display, although it can have persistence. The Vector style selection has no effect when you select XY format.

Save panel fields and controls

Use the Save panel controls to save the plot image or date to a file for inclusion in reports or further analysis in other applications.

Field or control Description
Save Plot Image Tap to open the Save As menu. Navigate to the location where you want to save the plot image. Enter a file name in the File Name field. Select the image file format (PNG, BMP, or JPG).

Tap OK to save the plot image.

Save Plot Data Tap to open the Save As menu. Navigate to the location where you want to save the plot data. Enter a file name in the File Name field.

Tap OK to save the plot data as a comma-separated values (.csv) file.

Closing a plot view

To close (delete) a Plot view, tap the X in the upper right corner of the view.

Deleting the Measurement badge that enabled the plot also closes the plot.

Save As configuration menu (plot Save panel, Save Plot Image button)

Use this menu to specify the name and location at which to save an image file for the selected plot.

To access the Save As configuration menu to save an image of a plot to a file:
  1. Double-tap anywhere in a Plot view top open the plot configuration menu.
  2. Tap the Save panel.
  3. Tap the Save Plot Image button.

Save As configuration menu (plot Save panel, Save Plot Image button) fields and controls

Field or control Description
Save Location Lists the location where the file will be saved. The default value is the last location to which a file was saved.

Tap on the file path and use a keyboard to enter a new save location. Or double-tap on the file name to open the virtual keyboard and enter a path.

Tap the down arrow icon on the right end of the field to open a list of recent file save locations for the current save type.

Browse Opens the Browse Save As Location configuration menu to navigate to and select a location at which to save the file.
File name The file name assigned to the file. The default value is either the user-entered name used to last save this file type, or a numeric value calculated by the instrument if this file type has not previously been saved with a custom file name. The default value is Tek000.

Tap the down arrow on the right edge of the field to display and select from a list of recently-saved file names.

Tap on the file name and use a keyboard to enter a new file name. Or double-tap on the file name to open the virtual keyboard and enter a file name.

Save As Type Lists the available graphic formats to which you can save files.

Tap the field and select the graphic save format.

Cancel Cancels the file save action and closes the configuration menu.
OK Saves the file to the specified location, closes the Save As menu, and displays a confirmation message.

Save As configuration menu (plot Save panel, Save Plot Data button)

Use this menu to specify the name and location at which to save a comma separated value (csv) file of the data for a specific plot.

To access the Save As configuration menu for plots:
  1. Double-tap anywhere in a Plot view top open the plot configuration menu.
  2. Tap the Save panel.
  3. Tap the Save Plot Data button.

Save As configuration menu (plot Save panel, Save Plot Data button) fields and controls

Field or control Description
Save Location Lists the location where the file will be saved. The default value is the last location to which a file was saved.

Tap on the file path and use a keyboard to enter a new save location. Or double-tap on the file name to open the virtual keyboard and enter a path.

Tap the down arrow icon on the right end of the field to open a list of recent file save locations for the current save type.

Browse Opens the Browse Save As Location configuration menu to navigate to and select a location at which to save the file.
File name The file name assigned to the file. The default value is either the user-entered name used to last save this file type, or a numeric value calculated by the instrument if this file type has not previously been saved with a custom file name. The default value is Tek000.

Tap the down arrow on the right edge of the field to display and select from a list of recently-saved file names.

Tap on the file name and use a keyboard to enter a new file name. Or double-tap on the file name to open the virtual keyboard and enter a file name.

Cancel Cancels the file save action and closes the configuration menu.
OK Saves the file to the specified location, closes the Save As menu, and displays a confirmation message.

Control Loop Response (Bode) plot configuration menu

Use this menu to change the settings of a displayed Control Loop Response plot (Control Loop Response measurement).

To open the Control Loop Response plot configuration menu, double-tap anywhere in a Control Loop Response plot view.

Settings panel (Control Loop Response plot configuration menu) fields and controls

Field or control Description
AutoScale Toggles AutoScale On or Off. Turn AutoScale off to manually set the X and Y-axis range and view an area of interest.

When AutoScale is off, a small Zoom window appears in the plot. Drag the blue vertical bar in the Zoom window to view that area in the main plot view. Use the Zoom and Pan front panel knobs to change the zoom area and position.

Gridlines Selects which gridlines to show in the plot. Select the grid style that meets your measurement needs.
Display Vectors draw waveforms with lines between record points.

Dots draw waveform record points as dots on the screen.

Interpolation Select the method to display the record points between sampled points.

Sin(x)/x connects using a Sin(x)/x curve between the computed values. This makes the gain or phase curve smoother than linear interpolation.

Linear connects between computed points (Gain or Phase value) using a straight-line fit. Measurement annotations are displayed for Linear mode interpolation only.

X-Axis (Frequency) Scale Sets the beginning and end scale range to display in the plot for the X-Axis scales.

This is displayed only when AutoScale is off (deselected).

Y-Axis (Gain) Scale Sets the beginning and end scale range to display in the plot for the Y-Axis scales.

This is displayed only when AutoScale is off (deselected).

Y-Axis (Phase) Scale Sets the beginning and end scale range to display in the plot for the Y-Axis scales.

This is displayed only when AutoScale is off (deselected).

Save panel fields and controls

Use the Save panel controls to save the plot image or date to a file for inclusion in reports or further analysis in other applications.

Field or control Description
Save Plot Image Tap to open the Save As menu. Navigate to the location where you want to save the plot image.

Enter a file name in the File Name field. Select the image file format (PNG, BMP, or JPG).

Tap OK to save the plot image.

Save Plot Data Tap to open the Save As menu. Navigate to the location where you want to save the plot data.

Enter a file name in the File Name field.

Tap OK to save the plot data as a comma-separated values (CSV) file. It saves the selected standard limits and computed Harmonic values.

Closing a plot view

To close (delete) a Plot view, tap the X in the upper right corner of the view.

Deleting the Measurement badge that opened the plot also closes the plot.

Reference waveform configuration menu

Use this menu to configure display settings for a reference waveform.

To open a reference waveform configuration menu, double-tap a Ref badge on the Settings bar.

Reference waveform configuration menu fields and controls

Field or control Description
Display Turns On or Off displaying the waveform.
Vertical Scale Set the vertical scale by using the assigned multipurpose knob, a virtual keypad, or tap the up or down arrows.
Label Adds a label to the waveform. Tap and enter text using a keyboard, or double-tap to open the virtual keyboard. The label text is the same color as the waveform.

Once you have entered the label, close the menu and double-tap the label text to open the Text Settings menu to change the font color, size, and other characteristics.

Units Set the units label that you want to display on the vertical scale.
Position Set the vertical position of the waveform using the assigned multipurpose knob or the virtual keypad.
Set to 0 Tap to set the vertical position to 0 (vertical center of the graticule).
Reference File Shows the path and file name of the current Reference waveform.

Double-tap the field to open the on-screen keyboard to enter or edit the path to open a different waveform file.

Tap the down arrow icon to list the 20 most recently accessed reference waveform files.

Browse Opens the Browse Waveform File dialog. Use this dialog to navigate to and select a waveform file to load. See Recall configuration menu (Ref waveform configuration menu).
Sample Rate, Record Length Readout-only text that show the sample rate and record length values of the reference waveform.
Deskew Changes the horizontal position of the reference waveform. Use this function to align the reference waveform to meet your measurement needs.
Set to 0 Sets the reference waveform deskew value to zero.

Recall configuration menu (Ref waveform configuration menu)

Use this menu to locate and load a reference waveform file.

Prerequisite: a Ref badge must be present on the Settings bar. See Add a math, reference, or bus waveform.

To open the Recall configuration menu:

  1. Double-tap a Ref badge on the Settings bar.
  2. Tap Browse to open the Recall configuration menu.

Recall configuration menu (Ref configuration menu) fields and controls

Field or control Description
Look in Shows the current directory path and file name.

Tap on the file path and use a keyboard to enter a new path. Or double-tap on the file name to open the virtual keyboard and enter a path.

Tap the down arrow icon on the right end of the field to open a list of recently accessed files, up to a maximum of 20.

The Drive column lists the directory structure, including any network-connected drives. Use to quickly navigate to a location.

Tap to list the contents of the directory in the file list area.

Double-tap an item, or tap the small arrow to the left of the directory, to display the subdirectories under it. Double-tap again to close that directory structure.

If there is a scroll bar, drag the list up and down to show more entries.

Use the arrow buttons to navigate the directory structure.

The left arrow navigates back to the previously visited folder.

The Right arrow navigates forward to the previously visited folder.

The Up arrow navigates up one level from the current folder.


Use to create a new directory (folder) at the current location.

Opens the new directory after it is created.

File Name Lists the selected file name.

Tap on the file path and use a keyboard to enter a new path. Or double-tap on the file name to open the on-screen keyboard and enter a path.

Tap the down arrow icon on the right end of the field to open a list of recently accessed files, up to a maximum of 20.

Files of Type Use to select the file format you want to open. Tap the field to show a list of all file extension types that the instrument can read for the selected file type. The files column only lists files of the specified type.
Cancel Cancels any changes, closes the menu, and returns to the prior menu without loading a file.
OK Closes the dialog, returns to the prior menu, and loads and displays the specified file.

Search configuration menu

Use the Search configuration menu to define conditions that you want to search for on a channel or waveform signal. Each occurrence of the search condition is marked on the signal with a triangle along the top of the waveform slice or view.

To open the Search menu, double-tap on a Search badge in the Results bar.

See the following links for information on the search type menus.

Bus Search configuration menus

Edge Search configuration menu

Logic search configuration menu

Pulse Width Search configuration menu

Rise/Fall Time Search configuration menu

Runt Search configuration menu

Setup and Hold Search configuration menu

Timeout Search configuration menu

Trigger configuration menu overview

Use the Trigger menu to define the channel or waveform signal conditions on which to trigger the oscilloscope. The trigger event establishes the time-reference point in the waveform record. All waveform record data is located in time with respect to the trigger point.

To quickly change the trigger source from one channel to another, double-tap on the Trigger badge. Select the new trigger source from the list. If you select a Digital channel, the list expands to show the individual digital channels. Single source trigger types include Edge, Pulse Width, Timeout, Runt, and Rise/Fall Time.

To access the Trigger configuration menu, double-tap the Trigger badge on the Settings bar. The Trigger menu opens to show the settings for the current trigger type.

Use the following links to see more information on specific trigger types and their configuration menus.

Edge Trigger configuration menu

Use the edge Trigger menu to trigger the instrument when a signal rises and/or falls through a specified level.

To open the Edge trigger menu:
  1. Double-tap the Trigger badge on the Settings bar.
  2. Set the Trigger Type to Edge.

Settings panel (Edge Trigger configuration menu) fields and controls

Field or control Description
Trigger Type Set to Edge.
Source Lists the source channel.

Internal source (Edge trigger): This provides a 60 Hz trigger source that can cause the oscilloscope to trigger 60 times per second.

AUX In: The AUX In (auxiliary) edge trigger source provides an extra trigger signal source when you need to use the input channels for other signals. For example, you might want to trigger on a clock while displaying related logic signals. The AUX In input cannot be displayed and is only for the purpose of triggering.

Coupling Set the conditioning to apply to the source signal trigger circuit from the source signal.

DC coupling passes all input signals directly to the trigger circuitry.

HF Reject coupling attenuates signals above 50 kHz before passing the signal to the trigger circuitry.

LF Reject coupling attenuates signals below 50 kHz before passing the signal to the trigger circuitry.

Noise Reject coupling provides stable triggering by increasing the trigger hysteresis. Increased hysteresis reduces the trigger sensitivity to noise so may require greater signal amplitude.

Level Sets the amplitude level that the signal must pass through to be considered a valid transition.
Slope Sets the signal transition direction to detect. (rising, falling, or either direction).

Mode & Holdoff panel (Edge Trigger configuration menu) fields and controls

Field or control Description
Trigger Mode The trigger mode determines how the instrument behaves in the absence or presence of a trigger event:

Auto trigger mode enables the instrument to acquire and display a waveform even if a trigger does not occur. Auto mode uses a timer that starts when the acquisition is started, and the pretrigger information is obtained. If a trigger event is not detected before the timer times out, the instrument forces a trigger. The length of time it waits for a trigger event depends on the time base setting.

Normal trigger mode enables the instrument to acquire a waveform only when it is triggered. If no trigger occurs, the last waveform record acquired remains on the display. If no last waveform exists, no waveform is displayed.

Force Trigger Forces a trigger event regardless of whether the waveform meets any trigger conditions.
Holdoff Time Tap the Holdoff Time field and use the multipurpose knob to adjust the holdoff time value. Or double-tap the field and use the virtual keypad to enter a time holdoff period. Trigger holdoff sets the amount of time the oscilloscope waits after a trigger event before detecting and triggering on the next trigger event. Use this option when the signal that you want to trigger on has several possible trigger points or is a burst signal.
Act on Trigger Tap the Act on Trigger button to configure the actions the instrument must take when a trigger event occurs.

See Act On Event configuration menu for the available fields and controls.

Pulse Width Trigger configuration menu

Use the Pulse Width Trigger to trigger on specific pulse width conditions, including when a pulse width is within or outside a range of specified times.

To open the Pulse Width trigger configuration menu:
  1. Double-tap the Trigger badge on the Settings bar.
  2. Set the Trigger Type to Pulse Width.

Settings panel (Pulse Width Trigger configuration menu) fields and controls

Field or control Description
Source Lists the source channel.
Trigger When
  • < Limit: A pulse width is less than the specified time limit.
  • > Limit: A pulse width is greater than the specified time limit.
  • = Limit: A pulse width is equal to the specified time limit.
  • ≠ Limit: A pulse width does not equal (is greater than or less than) the specified time limit.
  • Inside Range: A pulse width is in the specified time range.
  • Outside Range: A pulse width is outside of the specified time range.
Level Sets the amplitude level that the signal must pass through to be considered a valid transition.
Set to 50% Sets the threshold at 50% of the measured signal transition range. 50% is calculated as (Top + Bottom)/2.
Time Limit Sets the time period condition to be met.
High Time Limit

(Trigger When = Inside Range or Outside Range)

Sets the longest acceptable pulse width time period for the range condition.
Low Time Limit

(Trigger When = Inside Range or Outside Range)

Sets the shortest acceptable pulse width time period for the range condition.
Polarity Sets the polarity of the pulse to detect positive and negative pulse only.

Other trigger types

Timeout Trigger configuration menu

Use the Timeout Trigger to trigger on a waveform when an expected signal does not transition within a specified period of time, such as when a signal gets stuck either high or low.

To open the Timeout trigger menu:
  1. Double-tap the Trigger badge on the Settings bar.
  2. Set the Trigger Type to Timeout.

Settings panel (Timeout Trigger configuration menu) fields and controls

Field or control Description
Source Lists the source channel.
Trigger When
  • Stays High: The signal stays above the specified threshold level longer than the specified time.
  • Stays Low: The signal stays below the specified threshold level longer than the specified time.
  • Either: The signal stays above or below the specified threshold level longer than the specified time.
Threshold Sets the amplitude level that the signal must pass through to be considered a valid transition.
Set to 50% Sets the threshold at 50% of the measured signal transition range. 50% is calculated as (Top + Bottom)/2.
Time Limit Sets the time period condition to be met.

Other trigger types

Runt Trigger configuration menu

Use the Runt trigger to trigger on waveforms where a short pulse crosses one threshold but fails to cross a second threshold before recrossing the first.

To open the Runt trigger configuration menu:
  1. Double-tap the Trigger badge on the Settings bar.
  2. Set the Trigger Type to Runt.

Settings panel (Runt Trigger configuration menu) fields and controls

Field or control Description
Source Lists the source channel.
Trigger When
  • Occurs: A runt signal event occurs.
  • < Limit: A runt signal event occurs that has a pulse width less than the specified time limit.
  • > Limit: A runt signal event occurs that has a pulse width greater than the specified time limit.
  • = Limit: A runt signal event occurs that has a pulse width that is equal to the specified time limit (±5%).
  • ≠ Limit: A runt signal event occurs that has a pulse width that does not equal (is greater than or less than) the specified time limit (±5%).
Polarity Sets the polarity of the pulse to detect (positive pulse only, negative pulse only, or a positive or negative pulse).
Time Limit Sets the time period condition to be met.
Upper Threshold

Sets the upper amplitude level through which the signal must pass to be considered a valid transition.

Lower Threshold

Sets the lower amplitude level through which the signal must pass to be considered a valid transition.

Other trigger types

Logic Trigger configuration menu

Use the Logic trigger to trigger the oscilloscope when the specified logic conditions occur. The logic conditions include the state of each input, the condition to test (inputs go true, false, or are within a time limit), and the Boolean function of the inputs.

To open the Logic Trigger menu:
  1. Double-tap the Trigger badge on the Settings bar.
  2. Set the Trigger Type to Logic.

Settings panel (Logic Trigger configuration menu) - fields and controls

Field or control Description
Use Clock Edge? Enables or disables finding logic patterns that occur on the specified clock edge.
Logic Pattern Define Inputs Opens the Logic Trigger - Define Inputs menu where you define the logic state (High, Low, or Don't Care), and the signal threshold level that defines the logic state (high or low), for each analog or digital signal. See Logic Trigger - Define Inputs configuration menu.
Trigger When

(Use Clock Edge = No)

Defines the waveform condition on which to trigger.
  • Goes True: All conditions change to a true state.
  • Goes False: All conditions change to a false state.
  • Is True > Limit: Condition remains true longer than a specified time.
  • Is True < Limit: Condition remains true for less than a specified time.
  • Is True = Limit: Condition remains true for a specified time (within ± 5%).
  • Is True ≠ Limit: Condition does not remain true for a specified time (within ± 5%).
Clock Source

(Use Clock Edge = Yes)

Sets the signal to use as the clock.
Clock Edge

(Use Clock Edge = Yes)

Sets the signal transition edge (rising, falling, or either) for evaluating the logic condition at that clock transition.
Clock Threshold

(Use Clock Edge = Yes)

Sets the threshold level that the clock signal must pass through to be considered a valid transition. The clock threshold value is independent of the input signal threshold(s).
Define Logic Sets the logic condition that must occur with all inputs to cause a trigger event.
Sets the logic condition that must occur with all inputs.
  • AND: All conditions are true.
  • OR: Any condition is true.
  • NAND: One or more conditions are true.
  • NOR: No conditions are true.

Other trigger types

Logic Trigger - Define Inputs configuration menu

Use this menu to set the signal sources, logic states, and threshold levels to use for the Logic trigger.

To open the Logic Trigger - Define Inputs configuration menu:
  1. Double-tap the Trigger badge on the Settings bar.
  2. Set Trigger Type to Logic (if it is not already set to this).
  3. Tap the Logic Pattern Define Inputs button.

Logic Trigger - Define Inputs configuration menu fields and controls

Field or control Description
Ch(x) (analog channels) or D(x) (digital Channels Use to select the signal sources logic condition on which to perform the logic search (High, Low, Don't Care). Tap to select.

If a channel is a digital channel, tap the + symbol to open the list of digital inputs (D15-D8) or (D7-D0)from which to select individual digital signals.

Use the Threshold field to set the signal level that must be exceeded for that signal to be true (logical 1).

Set All Sets all signal sources to detect a logic High, Low, or Don't Care condition.

Setup and Hold Trigger configuration menu

Use the Setup & Hold trigger to trigger on a waveform when a data signal changes state inside of a specified setup and hold time, relative to a clock edge.

To open the Setup & Hold trigger configuration menu:
  1. Double-tap the Trigger badge on the Settings bar.
  2. Set the Trigger Type to Setup & Hold.

Settings panel (Setup & Hold Trigger configuration menu) fields and controls

Field or control Description
Clock Source Sets the signal to use as the clock.
Clock Level Sets the threshold level that the clock signal must pass through to be considered a valid transition. The clock threshold value is independent of the input signal threshold(s).
Clock Edge Sets the polarity of the clock edge (rising or falling) for evaluating the other menu conditions.
Data Sources: Define Inputs Opens the Setup & Hold Trigger - Define Inputs menu. Use this menu to select the input signals and their thresholds. See Setup and Hold Trigger - Define Inputs configuration menu.
Setup Time Sets the length of time that data signal should be stable and not change before a clock edge occurs.
Hold Time Sets the length of time that data signal should be stable and not change after a clock edge occurs.

Other trigger types

Setup and Hold Trigger - Define Inputs configuration menu

Use this menu to set the input signals and their threshold levels for the Setup & Hold trigger.

To open the Setup & Hold Trigger - Define Inputs dialog:

  1. Double-tap the Trigger Badge.
  2. Set the Trigger Type to Setup & Hold.
  3. Tap the Data Sources Define Inputs button.

Setup & Hold Trigger - Define Inputs configuration menu fields and controls

Field or control Description
Ch(x) (analog channels) or D(x) (digital Channels Use to select the signal sources to test for the setup and hold condition. Tap to select for each input source.

If a channel is a digital channel, tap the + symbol to open the list of digital inputs (D15-D8) or (D7-D0)from which to select individual digital signals.

Use the Threshold field to set the signal level that must be exceeded for that signal to be true.

Set All Sets all signal sources to be included or not included.

Rise/Fall Time Trigger configuration menu

Use the Rise/Fall Time trigger to trigger when the rise or fall time of a signal is less than, greater than, equal to, or not equal to a specified time limit.

To open the Rise/Fall Time trigger configuration menu:
  1. Double-tap the Trigger badge on the Settings bar.
  2. Set the Trigger Type to Rise/Fall Time.

Settings panel (Rise/Fall Time Trigger configuration menu) fields and controls

Field or control Description
Source Lists the source channel or waveform to use to trigger or search.
Trigger When
  • < Limit: A signal has a rise/fall time less than the specified time limit.
  • > Limit: A signal has a rise/fall time greater than the specified time limit.
  • = Limit: A signal has a rise/fall time that is equal to the specified time limit (±5%).
  • ≠ Limit: A signal has a rise/fall time that does not equal (is greater than or less than) the specified time limit (±5%).
Time Limit Sets the time period condition to be met.
Slope Sets the signal transition direction to detect. (rising, falling, or either direction).
Upper Threshold

Sets the upper amplitude level through which the signal must pass to be considered a valid transition.

Lower Threshold

Sets the lower amplitude level through which the signal must pass to be considered a valid transition.

Other trigger types

Bus Trigger configuration

Use the Bus trigger menus to trigger on bus-related events (Start, Stop, Missing Ack, Address, Data, and so on).

Note:You must add a bus to the Waveform view before you can trigger on it. Add a math, reference, or bus waveform.
To open the Bus trigger menu:
  1. Double-tap the Trigger badge on the Settings bar.
  2. Set the Trigger Type to Bus.
  3. Select the bus on which to trigger in the Source field.

Other trigger types

CAN serial bus trigger settings panel

Field or control Description
Source Select the CAN bus on which you want to trigger.
Trigger On Select the type of information on which to trigger.
Frame Type Sets the frame type on which to trigger.

Available when Trigger On = Type of Frame.

Direction Sets the transfer direction on which to trigger (Read, Write, Either).

Available when Trigger On = Identifier.

Identifier Format Sets the identifier for standard (11-bit) or extended (29-bit for CAN 2.0B) length.

Available when Trigger On = Identifier or ID & Data.

Identifier Sets the identifier pattern on which to trigger. The number of bits shown depends on the Identifier Format setting.

Tap the Binary or Hex field and use the A and B knobs to select and change the values. Or double-tap on the field and use the virtual keypad to enter values.

Available when Trigger On = Identifier or ID & Data.

Data Bytes Sets the number of data bytes on which to trigger (one to eight bytes). Use the A knob to change the value.

Available when Trigger On = Data or ID & Data.

Data Sets the data pattern on which to trigger. The number of bits shown depends on the Data Bytes setting.

Tap the Binary or Hex field and use the A and B knobs to select and change the values. Or double-tap on the field and use the virtual keypad to enter values.

Available when Trigger On = Data or ID & Data.

Data Offset Sets the byte offset value.

Available when Trigger On = Data or ID & Data.

Trigger When Sets the trigger when condition.

Available when Trigger On = Data or ID & Data.

Bit Rate Switch (BRS) Bit Sets the BRS bit state on which to trigger.

Available when Source is a CAN FD bus and Trigger On = FD Bits.

Error Status Indicator (ESI) Bit Sets the ESI bit state on which to trigger.

Available when Source is a CAN FD bus and Trigger On = FD Bits.

Error Type Sets the error type on which to trigger.

Available when Trigger On = Error.

A, B knob controls Use the A knob to select (highlight) the digit(s) to change.

Use the B knob to change the value of the digit(s).

Mode & Holdoff panel (Bus Trigger configuration panel) fields and controls

Field or control Description
Trigger Mode The trigger mode determines how the instrument behaves in the absence or presence of a trigger event:

Auto trigger mode enables the instrument to acquire and display a waveform even if a trigger does not occur. Auto mode uses a timer that starts when the acquisition is started, and the pretrigger information is obtained. If a trigger event is not detected before the timer times out, the instrument forces a trigger. The length of time it waits for a trigger event depends on the time base setting.

Normal trigger mode enables the instrument to acquire a waveform only when it is triggered. If no trigger occurs, the last waveform record acquired remains on the display. If no last waveform exists, no waveform is displayed.

Force Trigger Forces a trigger event regardless of whether the waveform meets any trigger conditions.
Holdoff Time Tap the Holdoff Time field and use the multipurpose knob to adjust the holdoff time value. Or double-tap the field and use the virtual keypad to enter a time holdoff period. Trigger holdoff sets the amount of time the oscilloscope waits after a trigger event before detecting and triggering on the next trigger event. Use this option when the signal that you want to trigger on has several possible trigger points or is a burst signal.
Act on Trigger Tap the Act on Trigger button to configure the actions the instrument must take when a trigger event occurs.

See Act On Event configuration menu for the available fields and controls.

I2C serial bus trigger settings panel

Field or control Description
Source Select the I2C bus on which to trigger.
Trigger On Select the type of information on which to trigger.
Direction Sets the transfer direction on which to trigger (Read, Write, Either).

Available when Trigger On is Address.

Addressing Mode Sets the slave device address length (7 bits or 10 bits long).

Available when Trigger On is Address or Address & Data.

Address Sets the address pattern on which to trigger. The number of bits shown depends on the Address Mode setting.

Tap the Binary or Hex field and use the A and B knobs to select and change the values. Or double-tap on the field and use the virtual keypad to enter values.

Available when Trigger On is Address or Address & Data.

Data Bytes Sets the number of data bytes on which to trigger (one to five bytes). Use the A knob to change the value.

Available when Trigger On is Data or Address & Data.

Data Sets the data pattern on which to trigger. The number of bits shown depends on the Data Bytes setting.

Tap the Binary or Hex field and use the A and B knobs to select and change the values. Or double-tap on the field and use the virtual keypad to enter values.

Available when Trigger On is Data or Address & Data.

A, B knob controls Use the A knob to select (highlight) the digit(s) to change.

Use the B knob to change the value of the digit(s). Or double-tap on the field and use the virtual keypad to enter values.

Mode & Holdoff panel (Bus Trigger configuration panel) fields and controls

Field or control Description
Trigger Mode The trigger mode determines how the instrument behaves in the absence or presence of a trigger event:

Auto trigger mode enables the instrument to acquire and display a waveform even if a trigger does not occur. Auto mode uses a timer that starts when the acquisition is started, and the pretrigger information is obtained. If a trigger event is not detected before the timer times out, the instrument forces a trigger. The length of time it waits for a trigger event depends on the time base setting.

Normal trigger mode enables the instrument to acquire a waveform only when it is triggered. If no trigger occurs, the last waveform record acquired remains on the display. If no last waveform exists, no waveform is displayed.

Force Trigger Forces a trigger event regardless of whether the waveform meets any trigger conditions.
Holdoff Time Tap the Holdoff Time field and use the multipurpose knob to adjust the holdoff time value. Or double-tap the field and use the virtual keypad to enter a time holdoff period. Trigger holdoff sets the amount of time the oscilloscope waits after a trigger event before detecting and triggering on the next trigger event. Use this option when the signal that you want to trigger on has several possible trigger points or is a burst signal.
Act on Trigger Tap the Act on Trigger button to configure the actions the instrument must take when a trigger event occurs.

See Act On Event configuration menu for the available fields and controls.

LIN serial bus trigger settings panel

Field or control Description
Source Select the LIN bus on which to trigger.
Trigger On Select the type of information on which to trigger.
Identifier Sets the identifier pattern on which to trigger.

Tap the Binary, Hex, or Decimal field and use the A and B knobs to select and change the values. Or double-tap on the field and use the virtual keypad to enter values.

Available when Trigger On = Identifier or Identifier & Data.

Data Sets the data pattern on which to trigger. The number of bits shown depends on the Data Bytes setting.

Tap the Binary or Hex field and use the A and B knobs to select and change the values. Or double-tap on the field and use the virtual keypad to enter values.

Available when Trigger On = Data or Identifier & Data.

Trigger When Sets the trigger when condition.

When set to Inside Range or Outside Range, fields are displayed to set a high and low boundary pattern for the specified trigger type.

Available when Trigger On = Data or Identifier & Data.

Data Bytes Sets the number of data bytes on which to trigger (one to eight bytes). Use the A knob to change the value.

Available when Trigger On = Data or Identifier & Data.

A, B knob controls Use the A knob to select (highlight) the digit(s) to change.

Use the B knob to change the value of the digit(s). Or double-tap on the field and use the virtual keypad to enter values.

Error Type Sets the LIN error type on which to trigger.

Available when Trigger On = Error.

Mode & Holdoff panel (Bus Trigger configuration panel) fields and controls

Field or control Description
Trigger Mode The trigger mode determines how the instrument behaves in the absence or presence of a trigger event:

Auto trigger mode enables the instrument to acquire and display a waveform even if a trigger does not occur. Auto mode uses a timer that starts when the acquisition is started, and the pretrigger information is obtained. If a trigger event is not detected before the timer times out, the instrument forces a trigger. The length of time it waits for a trigger event depends on the time base setting.

Normal trigger mode enables the instrument to acquire a waveform only when it is triggered. If no trigger occurs, the last waveform record acquired remains on the display. If no last waveform exists, no waveform is displayed.

Force Trigger Forces a trigger event regardless of whether the waveform meets any trigger conditions.
Holdoff Time Tap the Holdoff Time field and use the multipurpose knob to adjust the holdoff time value. Or double-tap the field and use the virtual keypad to enter a time holdoff period. Trigger holdoff sets the amount of time the oscilloscope waits after a trigger event before detecting and triggering on the next trigger event. Use this option when the signal that you want to trigger on has several possible trigger points or is a burst signal.
Act on Trigger Tap the Act on Trigger button to configure the actions the instrument must take when a trigger event occurs.

See Act On Event configuration menu for the available fields and controls.

Parallel serial bus trigger settings panel

Note:Parallel bus triggering is standard on all instruments.
Field or control Description
Source Select the type of information on which to trigger.
Data Sets the data pattern on which to trigger. The number of bits shown depends on how the parallel bus is defined.

Tap the Binary or Hex field and use the A and B knobs to select and change the values. Or double-tap on the field and use the virtual keypad to enter values.

A, B knob controls Use the A knob to select (highlight) the digit(s) to change.

Use the B knob to change the value of the digit(s).

Mode & Holdoff panel (Bus Trigger configuration panel) fields and controls

Field or control Description
Trigger Mode The trigger mode determines how the instrument behaves in the absence or presence of a trigger event:

Auto trigger mode enables the instrument to acquire and display a waveform even if a trigger does not occur. Auto mode uses a timer that starts when the acquisition is started, and the pretrigger information is obtained. If a trigger event is not detected before the timer times out, the instrument forces a trigger. The length of time it waits for a trigger event depends on the time base setting.

Normal trigger mode enables the instrument to acquire a waveform only when it is triggered. If no trigger occurs, the last waveform record acquired remains on the display. If no last waveform exists, no waveform is displayed.

Force Trigger Forces a trigger event regardless of whether the waveform meets any trigger conditions.
Holdoff Time Tap the Holdoff Time field and use the multipurpose knob to adjust the holdoff time value. Or double-tap the field and use the virtual keypad to enter a time holdoff period. Trigger holdoff sets the amount of time the oscilloscope waits after a trigger event before detecting and triggering on the next trigger event. Use this option when the signal that you want to trigger on has several possible trigger points or is a burst signal.
Act on Trigger Tap the Act on Trigger button to configure the actions the instrument must take when a trigger event occurs.

See Act On Event configuration menu for the available fields and controls.

RS-232 serial bus trigger settings panel

Field or control Description
Source Select the RS232 bus on which to trigger.
Trigger On Select the type of information on which to trigger.
Data Bytes Sets the number of data bytes (1 byte = 8 bits) on which to trigger (one to ten bytes). Use the A knob to change the value.

Available when Trigger On = Data.

Data Sets the data pattern on which to trigger. The number of bits shown depends on the Data Words setting.

Tap the Binary, Hex, or ASCII field and use the A and B knobs to select and change the values. Or double-tap on the field and use the virtual keypad to enter values.

Available when Trigger On = Data.

A, B knob controls Use the A knob to select (highlight) the digit(s) to change.

Use the B knob to change the value of the digit(s).

Mode & Holdoff panel (Bus Trigger configuration panel) fields and controls

Field or control Description
Trigger Mode The trigger mode determines how the instrument behaves in the absence or presence of a trigger event:

Auto trigger mode enables the instrument to acquire and display a waveform even if a trigger does not occur. Auto mode uses a timer that starts when the acquisition is started, and the pretrigger information is obtained. If a trigger event is not detected before the timer times out, the instrument forces a trigger. The length of time it waits for a trigger event depends on the time base setting.

Normal trigger mode enables the instrument to acquire a waveform only when it is triggered. If no trigger occurs, the last waveform record acquired remains on the display. If no last waveform exists, no waveform is displayed.

Force Trigger Forces a trigger event regardless of whether the waveform meets any trigger conditions.
Holdoff Time Tap the Holdoff Time field and use the multipurpose knob to adjust the holdoff time value. Or double-tap the field and use the virtual keypad to enter a time holdoff period. Trigger holdoff sets the amount of time the oscilloscope waits after a trigger event before detecting and triggering on the next trigger event. Use this option when the signal that you want to trigger on has several possible trigger points or is a burst signal.
Act on Trigger Tap the Act on Trigger button to configure the actions the instrument must take when a trigger event occurs.

See Act On Event configuration menu for the available fields and controls.

SENT serial bus trigger settings panel

Field or control Description
Source Select the SENT bus on which to trigger.
Trigger On Select the type of information on which to trigger.
Status / Communications Sets the value of the status/communications nibble on which to trigger.

Tap the Binary or Hex field and use the A and B knobs to select and change the values. Or double-tap on the field and use the virtual keypad to enter values.

Available when Trigger On = Fast Channel.

Fast Channel 1 Sets the condition and value of the fast channel 1 data on which to trigger.

Tap the down arrow and select the condition on which to trigger (=, ≠, >, <, ≥, ≤). The default is =.

Tap the Binary or Hex field and use the A and B knobs to select and change the values. Or double-tap on the field and use the virtual keypad to enter values.

Available when Trigger On = Fast Channel.

Fast Channel 2 Sets the condition and value of the fast channel 2 data on which to trigger.

Tap the down arrow and select the condition on which to trigger (=, ≠, >, <, ≥, ≤). The default is =.

Tap the Binary or Hex field and use the A and B knobs to select and change the values. Or double-tap on the field and use the virtual keypad to enter values.

Available when Trigger On = Fast Channel.

Message ID Sets the value of the message ID data on which to trigger.

Available when Trigger On = Slow Channel.

Data Sets the condition and value of the slow channel data on which to trigger.

Tap the down arrow and select the condition on which to trigger (=, ≠, >, <, ≥, ≤). The default is =.

Tap the Binary or Hex field and use the A and B knobs to select and change the values. Or double-tap on the field and use the virtual keypad to enter values.

Available when Trigger On = Slow Channel.

Low Value, High ValueSets the highest and lowest range of the number of data on which to trigger.

Tap the Low Value or High Value field and use the A and B knobs to set the values.

Available when Trigger On = Fast Channel and Fast Channel 1 or Fast Channel 2 = Inside Range or Outside Range.

Error Type Sets the error type on which to trigger. Tap the arrow and select the error condition.

Available when Trigger On = Error.

CRC Type Sets the CRC error type on which to trigger (Fast Channel or Slow Channel).

Available when Trigger On = Error and Error Type = CRC.

Mode & Holdoff panel (Bus Trigger configuration panel) fields and controls

Field or control Description
Trigger Mode The trigger mode determines how the instrument behaves in the absence or presence of a trigger event:

Auto trigger mode enables the instrument to acquire and display a waveform even if a trigger does not occur. Auto mode uses a timer that starts when the acquisition is started, and the pretrigger information is obtained. If a trigger event is not detected before the timer times out, the instrument forces a trigger. The length of time it waits for a trigger event depends on the time base setting.

Normal trigger mode enables the instrument to acquire a waveform only when it is triggered. If no trigger occurs, the last waveform record acquired remains on the display. If no last waveform exists, no waveform is displayed.

Force Trigger Forces a trigger event regardless of whether the waveform meets any trigger conditions.
Holdoff Time Tap the Holdoff Time field and use the multipurpose knob to adjust the holdoff time value. Or double-tap the field and use the virtual keypad to enter a time holdoff period. Trigger holdoff sets the amount of time the oscilloscope waits after a trigger event before detecting and triggering on the next trigger event. Use this option when the signal that you want to trigger on has several possible trigger points or is a burst signal.
Act on Trigger Tap the Act on Trigger button to configure the actions the instrument must take when a trigger event occurs.

See Act On Event configuration menu for the available fields and controls.

SPI serial bus trigger settings panel

Field or control Description
Source Select the SPI bus on which you want to trigger.
Trigger On Select the type of information on which to trigger.
Data Words Sets the number of data words (1 word = 8 bits) on which to trigger (one to sixteen bytes). Use the A knob to change the value.

Available when Trigger On = Data.

Data Sets the data pattern on which to trigger. The number of bits shown depends on the Data Words setting.

Tap the Binary or Hex field and use the A and B knobs to select and change the values. Or double-tap on the field and use the virtual keypad to enter values.

Available when Trigger On = Data.

A, B knob controls Use the A knob to select (highlight) the digit(s) to change.

Use the B knob to change the value of the digit(s).

Mode & Holdoff panel (Bus Trigger configuration panel) fields and controls

Field or control Description
Trigger Mode The trigger mode determines how the instrument behaves in the absence or presence of a trigger event:

Auto trigger mode enables the instrument to acquire and display a waveform even if a trigger does not occur. Auto mode uses a timer that starts when the acquisition is started, and the pretrigger information is obtained. If a trigger event is not detected before the timer times out, the instrument forces a trigger. The length of time it waits for a trigger event depends on the time base setting.

Normal trigger mode enables the instrument to acquire a waveform only when it is triggered. If no trigger occurs, the last waveform record acquired remains on the display. If no last waveform exists, no waveform is displayed.

Force Trigger Forces a trigger event regardless of whether the waveform meets any trigger conditions.
Holdoff Time Tap the Holdoff Time field and use the multipurpose knob to adjust the holdoff time value. Or double-tap the field and use the virtual keypad to enter a time holdoff period. Trigger holdoff sets the amount of time the oscilloscope waits after a trigger event before detecting and triggering on the next trigger event. Use this option when the signal that you want to trigger on has several possible trigger points or is a burst signal.
Act on Trigger Tap the Act on Trigger button to configure the actions the instrument must take when a trigger event occurs.

See Act On Event configuration menu for the available fields and controls.

Virtual Keyboard

Use the onscreen virtual keyboard to enter textual information such as a file path, file name, label text, or on-screen callout.

To access the virtual keyboard, double-tap in a menu or dialog text input box. Enter your text and tap Enter to close the keyboard and add your text to the menu or dialog field.

Tap ESC, Cancel, or anywhere outside the keyboard, to dismiss it without adding text to the input box.

Single-tap in the keyboard text field to position the insertion cursor at that location. Double-tap to select individual words. Triple-tap to select all text in the field.

Touch and drag the title bar to move the keyboard on the screen.

Other than the standard English language, the virtual keyboard also supports German, French, and Italian languages for interacting with the oscilloscope.

Bus trigger radix-specific virtual keypads

Use the virtual Logic keypad to edit bus logic values for trigger settings. Using a logic keypad is faster to set larger logic trigger values than using the multipurpose knobs in the trigger menu.

To open the virtual Logic keypad, double-tap inside a bus trigger field that requires logic values. Which field you select (Binary, Hex, and so on) sets which Logic keypad is displayed.

Virtual Keypad fields and controls

Field or control Description
Clear Sets all digits to X (don't care) for binary, hex, octal and ASCII formats. Decimal gets set to 0.
< Moves the insertion point left and highlights the character that can be edited.
> Moves the insertion point right and highlights the character that can be edited.
Radix keypad Provides a keypad associated with the logic entry radix field that was double-tapped in the Trigger menu. Tapping a key sets the selected digit to the specified value and moves the selected digit indicator to the next (right) digit.

You can also use an attached keyboard to enter values in the keypad character field.

Enter Closes the number pad and assigns the entered value to the field. Also updates all other formats in the trigger menu so that all formats are indicating the same value.
Cancel Closes the logic keypad without saving entered values.

Virtual Keypad

Use the virtual Keypad to enter numeric values and units for settings.

To open the virtual keypad, double-tap inside a field that requires numeric values.

Virtual Keypad fields and controls

Field or control Description
Clear Clears all values from the input entry field.
Exp Lets you enter exponential notation entries.
Max Enters the maximum value allowed for this setting.
Min Enters the minimum value allowed for this setting.
Bksp ← Deletes characters to the left of the insert text marker position.
Enter Closes the number pad and assigns the entered value to the field.
± Tap the button to set a numeric value to a positive (default) or negative value.
Unit buttons Use to set the units of the entered value.

Waveform View configuration menu

Use this menu to configure the Waveform View to set display mode (Stacked or Overlay), waveform interpolation method, persistence, and other parameters.

To open the Waveform View menu, double-tap anywhere in the Waveform View screen.

Waveform View menu fields and controls

Fields or controls Description
Display Mode Sets how waveforms are shown on the screen.

Overlay mode displays all waveforms on the screen, overlaid on each other. This is the traditional way that oscilloscopes displayed waveforms, and lets you overlay waveforms to do direct comparisons of waveform shape. The grid vertical position and scale values change for each selected waveform.

Stacked mode draws each waveform in an individual section, or slice, of the screen, stacked one on top of the other. This lets you view each waveform uncluttered by overlaying waveforms. Each waveform slice displays its own vertical scale units. A trigger level indicator in a slice indicates that that waveform is the trigger source.

Interpolation Selects the method used to display record points between sampled points.

Sin(x)/x computes record points along a curve between the actual acquired samples. This form of interpolation is useful when acquiring rounded waveforms such as sine waves. It is good for general-purpose uses but may introduce overshoot or undershoot in signals with fast rise times. This interpolation is also useful for looking at high-frequency signals, especially where the frequency components are just below the Nyquist frequency.

Linear computes record points between actual acquired samples using a straight-line fit. This interpolation is useful for measuring waveforms with fast rise times, such as pulse trains.

Persistence Sets the length of time data points are displayed on screen before being erased.

Off sets the record points to appear for the current acquisition only.

Infinite continuously accumulates record points on the waveform until you change one of the acquisition display settings or clear the acquisition memory. Use infinite persistence for displaying record points that may occur outside the normal acquisition envelope.

Variable lets you specify a time length to retain data points on screen. Each record point decays independently according to the time interval.

Auto sets the Waveform Intensity field to control the persistence time.

Variable Persistence Time

(Persistence = Variable)

Sets the length of time data points remain displayed. Tap the field and use the A knob to adjust, or double-tap and use the keypad to set a time.
Waveform Style Sets how waveforms are drawn on the screen.

Vectors draws waveforms with lines between record points.

Dots draws waveform record points as dots on the screen, and adds crosshair markers to real sampled points.

Waveform Intensity Sets the brightness of the waveform. Tap the field and use the A knob to set the waveform intensity.
Graticule Style Sets the type of graticule to display.

Grid shows a traditional grid on the instrument display. This is the default grid mode.

Time displays vertical graticules for just the horizontal (time) scale units.

Full displays the same style graticule lines for both horizontal and vertical scale units

None turns off the graticule, including the vertical scale readouts.

Graticule Intensity Sets the brightness of the graticule. Tap the field and use the A knob to set the graticule intensity.

Waveform acquisition

Acquisition concepts

The Acquisition system sets which data points are used to acquire waveforms.

Acquisition hardware

Before a signal is displayed, it must pass through the input channel where it is scaled and digitized. Each channel has a dedicated input amplifier and digitizer. Each channel produces a stream of digital data from which the instrument extracts waveform records.

Sampling process

Acquisition is the process of sampling an analog signal, converting it into digital data, and assembling it into a waveform record, which is then stored in acquisition memory.


Real-Time sampling

In real-time sampling, the instrument digitizes all of the points it acquires using one trigger event. Use real-time sampling to capture single-shot or transient events.


Interpolated Real-Time sampling

In interpolated real-time sampling, the instrument digitizes all of the points it acquires using one trigger event. If the instrument cannot acquire enough samples for a complete waveform at the maximum real-time sample rate, it interpolates. Use interpolated real-time sampling to capture single-shot or transient events.

Waveform record

The instrument builds the waveform record through use of the following parameters:

  • Sample interval: The time between sample points.
  • Record length: The number of samples required to fill a waveform record.
  • Trigger point: The zero time reference in a waveform record.
  • Horizontal position: When horizontal delay is off, the horizontal position is a percentage of the waveform record between 0 and 99.9 percent. The trigger point and the horizontal reference are at the same time in the waveform record. For example, if the horizontal position is 50 percent, then the trigger point is in the middle of the waveform record. When horizontal delay is on, the time from the trigger point to the horizontal reference is the horizontal delay.


Interpolation

Your instrument can interpolate between the samples it acquires when it does not have all of the actual samples it needs to fill the waveform record. Linear interpolation computes record points between actual acquired samples by using a straight line fit.

Sin(x)/x interpolation computes record points using a curve fit between the actual values acquired. Sin(x)/x interpolation is the default interpolation mode because it requires fewer actual sample points than linear interpolation to accurately represent the waveform.

Acquisition modes

Acquisition is the process of sampling an analog signal, converting it into digital data, and assembling it into a waveform record, which is then stored in acquisition memory. The acquisition mode determines how the waveform record points are calculated from the sampled waveform data.

How the acquisition modes work:

Acquisition mode
Sample mode retains the first sampled point from each acquisition interval. Sample is the default mode. The instrument does no post processing of the acquired samples in this mode.

Peak Detect mode retains the highest and lowest values of all the samples in each acquisition interval. This mode only works with real-time, noninterpolated sampling and is useful for catching high frequency glitches.

High Res mode applies unique FIR filtering based on the current sample rate. This FIR filter maintains maximum bandwidth possible for that sample rate while rejecting aliasing. The filter removes noise from the oscilloscope amplifiers and ADC above the usable bandwidth for the selected sample rate. Implementation of the filter in hardware, ahead of the trigger and storage, reduces trigger jitter and enables Fast Acq while in High Res mode.

Envelope mode finds the highest and lowest record points over many acquisitions. Envelope uses Peak Detect for each individual acquisition.

Average mode calculates the average value for each record point over many acquisitions. Average uses Sample mode for each individual acquisition. Use Average mode to reduce random noise.

Roll Mode scrolls sequential waveform points across the display in a right-to-left rolling motion. Roll Mode starts automatically when the timebase is set to ≥40 ms/div. Roll Mode works at sample rates up to 25 MS/s.

Waveform sample interpolation

When the sample density falls to less than one sample per display column, the instrument must calculate intermediate points to display a waveform. This process is called interpolation.

There are three options for interpolation:

  • Sin(x)/x interpolation. Computes record points using a curve fit between the actual values acquired. It assumes that all the interpolated points fall along that curve.
  • Linear interpolation. Computes record points between actual acquired samples by using a straight line fit. It assumes that all the interpolated points fall in their appropriate point in time on that straight line.
  • Auto interpolation. Select the best interpolation method.

Coupling

Coupling determines whether an input signal is directly connected to the input channel (DC coupling), connected through a DC blocking capacitor (AC coupling), or not connected at all (GND coupling).

All probes expect a specific coupling and input termination. Both coupling and input termination are displayed on the screen.

Scaling and positioning

The scaling and positioning controls determine the portion of the input signal received by the acquisition system. Set the vertical scaling, positioning, and DC offsets to display the features of interest on your waveform and to avoid clipping.

Each waveform Graticule contains ten major divisions. This represents the maximum digitizing range of the instrument for any given vertical scale. Vertical waveform data that is outside (above and/or below) of the waveform Graticule is clipped; that is, the data values exceed the digitizing capability of the ADC at the current settings. This causes inaccuracies in amplitude-related measurements. For more information see Vertical acquisition considerations.


Set the horizontal scale, position, and resolution (record length) to include the acquired waveform record waveform attributes of interest with good sampling density on the waveform. These settings define the horizontal acquisition window, described in Horizontal acquisition considerations .

Note:The terms vertical acquisition window and horizontal acquisition window refer to the vertical and horizontal range of the segment of the input signal that the acquisition system acquires. The terms do not refer to any display windows on screen.

Vertical acquisition considerations

You can set the vertical scale, position, and offset of each channel independently of other channels. Vertical scale and offset specify the vertical parameters of the waveform display for each channel. The oscilloscope only acquires signals that fall within these parameters.

The offset control subtracts a constant DC level from the input signal before the vertical scale factor is applied, and the vertical position control adds a constant number of divisions of signal after the scale factor is applied to the resulting difference.

The vertical scale and position controls have the following effects on the waveform display and the displayed waveform:

The vertical volts per division you set determines the vertical size of the waveform display, allowing you to scale it to contain all of a waveform amplitude or only part.

Note:Amplitude-related automatic measurements (for example, peak-to-peak and RMS) will be accurate for vertical windows if the waveform is not clipped (that is, the waveforms are acquired). But if signal amplitude were to extend outside the vertical acquisition window, the data acquired is clipped. Clipped data causes inaccurate results if used in amplitude-related automatic measurements. Clipping also causes inaccurate amplitude values in waveforms that are stored or exported for use in other programs.

If the scale of a math waveform is changed so that the math waveform is clipped, it will affect the amplitude measurements on that math waveform as follows:

  • The vertical position adjusts the display of the graticule relative to the waveform display (position is a display control). That is all position does; it does not determine what data is acquired as do vertical scale and offset.
  • As you vary vertical offset, the middle voltage level moves relative to zero. This moves the waveform display up or down relative to the acquired waveform. With input signals that are smaller than the window, it appears the waveform moves in the waveform view. Actually, the offset moves the middle of the waveform display up and down on the input signal. Offset moves the waveform display to control the portion of the waveform amplitude the display captures.
  • Applying a negative offset moves the vertical range down relative to the DC level of the input signal. Likewise, applying a positive offset moves the vertical range up.

Horizontal acquisition considerations

These parameters are shown in the next figure (horizontal window with delay on):

  • The trigger position determines where the trigger event will be located in the waveform record. To see more pretrigger data move your trigger position to the right on the graticule.

  • The horizontal position determines the number of pretrigger and posttrigger samples. Samples before the trigger point are pretrigger samples and those after the trigger point are posttrigger samples. When Delay is off, the horizontal position is the same as the trigger position.

  • The horizontal delay determines the time from the trigger point to the Horizontal Reference.

  • The horizontal scale determines the horizontal size of the relative to any waveform, allowing you to scale it to contain a waveform edge, a cycle, or several cycles.

Triggering concepts

User selected trigger conditions are used to capture waveforms for measurement and analysis.

The next figure shows how triggers fit into the overall instrument operation.


Trigger helps you to capture meaningful waveforms to display on screen. This instrument has simple edge triggers as well as a variety of advanced triggers.


The trigger event

The trigger event establishes the time-zero point in the waveform record. All waveform record data are located in time with respect to that point. The instrument continuously acquires and retains enough sample points to fill the pretrigger portion of the waveform record (that part of the waveform that is displayed before or to the left of the triggering event on screen).

When a trigger event occurs, the instrument starts acquiring samples to build the post-trigger portion of the waveform record (displayed after or to the right of the trigger event). Once a trigger is recognized, the instrument will not accept another trigger until the acquisition is complete and the holdoff time has expired.

Trigger sources

The trigger source provides the signal that triggers acquisition. Use a trigger source that is synchronized with the signal that you are acquiring and displaying.

You can derive your trigger from the following sources:

  • Input channels: Analog input channels are the most commonly used trigger sources. You can select any of the input channels. The channel that you select as a trigger source will function whether it is displayed or not.
  • Digital channels: These sources are available if you have a digital probe connected to a oscilloscope. You can select any combination of digital channels.
  • Bus: This source is used to trigger a parallel bus or a serial bus. You can include any combination of analog, digital, or math to build a parallel bus or use any channel as a component in a serial bus.

Trigger types

The available trigger types include:

Edge: This is the simplest and most commonly used trigger type, used with analog signal. An edge trigger event occurs when the trigger source passes through a specified voltage level in the specified direction (rising or falling signal voltage). When the edge trigger source is set to Internal, the instrument uses an internally generated 60 Hz signal to generate a trigger. The 2 Series MSO also have an AUX In connector that is available as another source for the Edge trigger.

Pulse Width: Trigger on pulses that are inside or outside a specified time range. Can trigger on positive or negative pulses.

Timeout: Trigger when no edge transition is detected within a specified time.

Runt: Use Runt trigger to trigger on a pulse amplitude that crosses one threshold but fails to cross a second threshold before recrossing the first. It can detect any positive or negative runts, or those that are inside or outside a specified time range. These pulses can also be qualified by the logical state of other channels.

Logic: These are special-purpose triggers that are primarily used with digital logic signals. Logic triggers are available on the main (A) and B event triggers.

Setup & Hold: Trigger when a logic input changes state inside the setup and hold times relative to the clock. This type triggers on a setup and hold violation.

Rise/Fall Time: Trigger on pulse edges that traverse between two thresholds at faster or slower rates than the specified time. The pulse edges can be positive or negative.

Bus: This trigger is used with both analog and digital signals to set up parallel and serial buses. A bus trigger event occurs when the instrument detects a bus pattern that you set in a bus trigger configuration menu. You must add a bus to the Waveform view before you can set the trigger parameters for that bus.

Trigger modes

The trigger mode determines how the instrument behaves in the absence of a trigger event:

  • Normal trigger mode enables the instrument to acquire a waveform only when it is triggered. If no trigger occurs, the instrument does not acquire a waveform, and the last waveform record acquired remains on the display. If no last waveform exists, no waveform is displayed.
  • Auto trigger mode enables the instrument to acquire a waveform even if a trigger does not occur. Auto mode uses a timer that starts after a trigger event occurs. If another trigger event is not detected before the time out, the instrument forces a trigger. The length of time it waits for a trigger event depends on the time base setting.

Auto mode, when forcing triggers in the absence of valid triggering events, does not synchronize the waveform on the display. In other words, successive acquisitions are not triggered at the same point on the waveform. If valid triggers occur, the display becomes stable.

Trigger holdoff

Trigger holdoff can help stabilize triggering. When the instrument recognizes a trigger event, it disables the trigger system until acquisition is complete. In addition, the trigger system remains disabled during the holdoff period. Adjust holdoff to obtain stable triggering when the instrument is triggering on undesired trigger events.

A digital pulse train is a good example of a complex waveform. Each pulse looks like any other, so many possible trigger points exist. Not all of these will result in the same display. The holdoff period allows the instrument to trigger on the correct edge, resulting in a stable display.

The Holdoff setting range is  0 s (minimum holdoff available) to 10 s (maximum holdoff available). For more information on how to set holdoff, see Set Trigger Holdoff.

Learn about Trigger coupling

Learn about Trigger modes

Trigger coupling

Trigger coupling determines what part of the signal is passed to the trigger circuit. Edge triggering can use all available coupling types: DC, Low Frequency Rejection, High Frequency Rejection, and Noise Rejection. All of the advanced trigger types use DC coupling only.

  • DC. This coupling passes all input signals to the trigger circuitry.
  • HF Reject. This coupling attenuates signals above 50 kHz before passing the signal to the trigger circuitry.
  • LF Reject. This coupling attenuates signals below 50 kHz before passing the signal to the trigger circuitry.
  • Noise Reject. This coupling provides stable triggering by increasing the trigger hysteresis. Increased hysteresis reduces the trigger sensitivity to noise but may require greater signal amplitude.

Trigger slope and level

The slope control determines whether the instrument finds the trigger point on the rising or the falling edge of a signal. The level control determines where on that edge the trigger point occurs. See the next figure.


Learn about trigger position

Trigger position in waveform record

Trigger position is an adjustable feature that defines where the trigger occurs on the waveform record. It lets you choose how much the instrument acquires before and after the trigger event. The part of the record that occurs before the trigger is the pretrigger portion. The part that occurs after the trigger is the posttrigger portion. A longer posttrigger period may be useful when you want to see the effects an event has on your system under test.

Pretrigger data can be valuable when troubleshooting. For example, if you are trying to find the cause of an unwanted glitch in your test circuit, you can trigger on the glitch and make the pretrigger period large enough to capture data before the glitch. By analyzing what happens before the glitch, you may uncover information that helps you find the source of the glitch.

Advanced triggering

You can check the advanced trigger status in the settings bar. The readout indicates the trigger type and then shows sources, levels, or any other parameters that are important for the particular trigger type.

Bus triggering concepts

A bus trigger occurs when a supported instrument detects a bus pattern that you specify for a parallel bus, or a bus cycle you select for a serial bus.

You can set the instrument to trigger on a parallel bus when the instrument detects a match to the bus pattern, or when the instrument detects that the value on the bus is < or > the value of the bus pattern. The pattern can be in Binary or Hex format.

You can set the instrument to trigger on an SPI bus when the instrument detects an SS Active bus cycle or Data.

You can set the instrument to trigger on an I2C bus when the instrument detects a Start, Stop, Repeated Start, Missing Ack, Address, Data, or Addr + Data bus cycle or activity.

You can set the instrument to trigger on an RS­232 bus when the instrument detects a Start, End of Packet, Data, or Parity Error bus cycle or activity.

You can set the instrument to trigger on an CAN bus when the instrument detects a Start of Frame, Type of Frame, Identifier, Data, Id and Data, End of Frame, Missing Acq, or Bit Stuffing Error bus cycle or activity.

You can set the instrument to trigger on an LIN bus when the instrument detects a Sync, Identifier, Data, Identifier & Data, Wakeup Frame, Sleep Frame, or Error bus cycle or activity.

For all the serial standard buses, you can also set the component threshold levels through the Bus Setup menu.

Pulse width trigger concepts

A pulse width trigger occurs when the instrument detects a pulse that is inside or outside some specified time range. The instrument can trigger on positive or negative width pulses.

Timeout trigger concepts

A timeout trigger occurs when the instrument does not detect an expected pulse transition within a user specified period of time, such as when a signal gets stuck either high or low. If the pulse transition occurs prior to a specified timeout time (the expected case), then no trigger results.

Runt trigger concepts

A runt trigger occurs when the instrument detects a short pulse that crosses one threshold but fails to cross a second threshold before recrossing the first. You can set the instrument to detect any positive or negative runts, or those that are inside or outside a specified time range.

Logic trigger concepts

Trigger the instrument when logic patterns are true. You can set each bit to be active High, Low, or Don't Care. You can also set the logic thresholds and define the logic (AND, OR, NOR, or NAND).

Setup and Hold trigger concepts

A setup/hold trigger occurs when a data signal changes state inside of the user specified setup and hold times relative to the clock. When you use setup/hold triggering, you define:

  • The channel containing the logic input (the data source) and the channel containing the clock (the clock source)
  • The direction of the clock edge to use
  • The clocking level and data threshold that the instrument uses to determine if a clock or data transition has occurred
  • The setup and hold times that together define a time range relative to the clock

Data that changes state within the setup/hold violation zone triggers the instrument. The next figure shows how the setup and hold times that you choose position the violation zone relative to the clock.


Setup/hold triggering uses the setup/hold violation zone to detect when data is unstable too near the time it is clocked. Each time trigger holdoff ends, the instrument monitors the data and clock sources. When a clock edge occurs, the instrument checks the data stream it is processing (from the data source) for transitions occurring within the setup/hold violation zone. If any occur, the instrument triggers with the trigger point located at the clock edge.

The setup/hold violation zone spans the clocking edge as shown above. The instrument detects and triggers on data that does not become stable long enough before the clock (setup time violation) or that does not stay stable long enough after the clock (hold time violation).

Rise/Fall time trigger concepts

Rise/Fall time triggering is based on the slope (change in voltage/change in time) of a pulse edge.

Use the Rise/Fall trigger to trigger the instrument on pulse edges that traverse between two thresholds at faster or slower rates than the specified time. You can set up the instrument to trigger on positive or negative edges.

Waveform display concepts

This instrument includes a flexible, customizable display that lets you control how waveforms appear. The figure shows how the display features fit into the overall instrument operation.


The display shows analog, digital, math, reference, and bus waveforms. The waveforms include channel markers, individual waveform graticule readings, and trigger source and level indicators. You can set the display to stack each waveform vertically in separate graticules, called 'slices' (the default mode), or overlay all the waveforms on the screen (traditional waveform view).

Waveform preview mode

The waveform preview attempts to show what the next acquisition will look like when the acquisition is delayed due to slow triggers or long acquisition duration, or when the acquisitions have stopped. Waveform preview recalculates math waveforms, but does not represent changes in trigger levels, trigger modes, or different acquisition modes.

Horizontal position and the horizontal reference point

The time value you set for horizontal position is measured from the trigger point to the horizontal reference point. This is not the same as the time value from the trigger point to the start of the waveform record, unless you set the horizontal reference to 0%. See the next figure.


Measurement concepts

Measurement variables

By knowing how the instrument makes calculations, you may better understand how to use your instrument and how to interpret your results. The instrument uses a variety of variables in its calculations. These include:

Definition of Base and Top

Base is the value used as the 0% level in measurements such as fall time and rise time.

Top is the value used as the 100% level in measurements such as fall time and rise time. For example, if you set the 10% to 90% rise time, then the instrument calculates 10% and 90% as percentages of Top and Base, with Top representing 100%.

The exact value of Base and Top depends on which Base Top Method you select in the Reference Levels panel of a Measurement configuration menu. It also depends on if you set the reference level to be Global (applies to all measurements set as Global in the Reference Levels panel), or Local (just applies to the measurement that is set to Local).

Base, Top calculation methods

The Base Top calculation method is set in the Reference Levels panel of a Measurement configuration menu.

Auto is the default method, and automatically determines the best Base Top method to use. Most commonly sets the Base Top method to Histogram Mode.

MinMax defines the 0% and the 100% waveform levels as the lowest value and the highest value samples of the waveform record. This setting is best for examining waveforms that have no large, flat portions at a common value, such as sine waves and triangle waves - almost any waveform except for pulses.

The MinMax method calculates the Top and Base values as follows:

Top = Max

and

Base = Min


Histogram Mean uses histogram analysis to calculate the mean or average value using all values above and below the waveform midpoint. Top is set to the mean high value, and Base is set to the mean low value. This setting is best for examining eye patterns and optical signals.

Histogram Mode uses histogram analysis to select the most common values either above or below the midpoint. Since this statistical approach ignores short-term aberrations (overshoot, ringing, and so on), Mode is the best setting for examining pulses.

The oscilloscope calculates the histogram-based Top and Base values as follows:
  1. It makes a histogram of the record with one bin for each digitizing level.
  2. It splits the histogram into two sections at the halfway point between Min and Max (also called Mid).
  3. The level with the most points in the upper histogram is the Top value, and the level with the most points in the lower histogram is the Base value.

    If Mid gives the largest peak value within the histogram, the oscilloscope returns the Mid value for both Top and Base (this is probably a very low amplitude waveform).

    If more than one histogram level (bin) has the maximum value, the oscilloscope chooses the bin farthest from Mid.

This algorithm does not work well for two-level waveforms with greater than about 100% overshoot.

HighRef, MidRef, LowRef

You set the various reference levels, through the Reference Levels tab of the Measure menu. They include:

High is the waveform high reference level (also HighRef). Used in all measurements. Typically set to 90%. You can set it from 0% to 100% or to a voltage level.

Mid is the waveform middle reference level (also MidRef). Mid reference levels are used in all measurements that need to find edges. Typically set to 50%. You can set it from 0% to 100% or to a voltage level.

Low is the waveform low reference level (also LowRef). Used in all measurements. Typically set to 10%. You can set it from 0% to 100% or to a voltage level.

High, mid and low reference levels can be set uniquely for each measurement source. Reference levels can also be set differently for rising edge detection and falling edge detection.

Other variables

The instrument also measures several values itself that it uses to help calculate measurements.

Record Length is the number of data points in the time base. You set it with the Horizontal menu Record Length item.

Start is the location of the start of the measurement zone (X-value). It is 0.0 samples unless you are making a gated measurement. When you use cursor gated measurements, it is the location of the left vertical cursor.

End is the location of the end of the measurement zone (X-value). It is (RecordLength – 1.0) samples unless you are making a gated measurement. When you use cursor gated measurements, it is the location of the right vertical cursor.

Hysteresis Is the hysteresis band of the waveform amplitude.

For example, once a crossing has been measured in a negative direction, the waveform data must fall below the hysteresis value of the amplitude from the Mid reference point before the measurement system is armed and ready for a positive crossing. Similarly, after a positive Mid reference crossing, waveform data must go above the hysteresis value of the amplitude before a negative crossing can be measured. Hysteresis is useful when you are measuring noisy signals, because it allows the oscilloscope to ignore minor fluctuations in the signal.

Edge calculations

Edge1, Edge2, and Edge3 refer to the first, second, and third Mid reference edge times, respectively.

An edge can be detected when the waveform is either rising or falling past Midref. The direction of the edges alternates, that is, if Edge1 is rising, Edge2 will be falling.

A rising edge has positive polarity. A falling edge has negative polarity.


The instrument calculates these values as follows:
  1. Find the first Mid reference edge in the waveform record or the gated region. This is Edge1.
  2. Continuing from Edge1, find the next Mid reference edge in the waveform record (or the gated region) of the opposite direction of Edge1. This is Edge2.
  3. Continuing from Edge2, find the next Mid reference edge in the waveform record (or the gated region) of the same direction as Edge1. This is Edge3.
Cycle-cycle measurements are made on each cycle of the waveform. In the diagram above a cycle starts at Edge1 and ends at Edge3.

TPOS is the location of the sample just before the trigger point (the time reference zero sample). In other terms, it contains the domain reference location. This location is where time = 0.

TSOFF is the offset between TPOS and the actual trigger point. In other words, it is the trigger sample offset. Values range between 0.0 and 1.0 samples. This value is determined by the instrument when it receives a trigger. The actual zero reference (trigger) location in the measurement record is at (TPOS + TSOFF).

Missing or out-of-range samples

If some samples in the waveform are missing or off-scale, the measurements will interpolate between known samples to make an appropriate guess as to the sample value. Missing samples at the ends of the measurement record will be assumed to have the value of the nearest known sample. The interpolation method can be changed in User Preferences.

When samples are out of range, the measurement will give a warning to that effect (for example, CLIPPING) if the measurement could change by extending the measurement range slightly. The algorithms assume the samples recover from an overdrive condition instantaneously.

Math waveforms

Once you have acquired waveforms or taken measurements on waveforms, the instrument can mathematically combine them to create a waveform that supports your data-analysis task. For example, you might have a waveform clouded by background noise. You can obtain a cleaner waveform by subtracting the background noise from your original waveform. Or, you can integrate a single waveform into an integral math waveform as shown below.


This instrument supports mathematical combination and functional transformations of waveforms it acquires. The next figure shows this concept:


You create math waveforms to support the analysis of your channel and reference waveforms. By combining and transforming source waveforms and other data into math waveforms, you can derive the data view that your application requires. Create math waveforms that result from:
  • Mathematical operations on one or several waveforms: add, subtract, multiply, and divide.
  • Functional transformations of waveforms, such as integration, differentiation, and so on.

Math waveform elements

You can create Math waveforms from the following:
  • Channel waveforms
  • Reference waveforms
  • Measurement scalars (automated measurements) that measure channel, reference, or math waveforms, or histograms.
  • Other math waveforms

Dependencies

In general, math waveforms that include sources as operands are affected by updates to those sources:
  • Shifts in amplitude or DC level of input sources that cause the source to clip also clip the waveform data supplied to the math waveform.
  • Changes to the vertical offset setting for a channel source that clips its data also clips the waveform data supplied to the math waveform.
  • Changes to the acquisition mode globally affects all input channel sources, modifying any math waveforms using them. For example, with the acquisition mode set to Envelope, a Ch1 + Ch2 math waveform will receive enveloped channel 1 and channel 2 data, and will also be an envelope waveform.
  • Clearing the data in a waveform source causes a baseline (ground) to be delivered to any math waveform that includes that source until the source receives new data.

Math waveform sources

You can create Math waveforms from the following:

  • Channel waveforms
  • Reference waveforms
  • Measurement scalars (automated measurements) that measure channel, reference, or math waveforms, or histograms.
  • Other math waveforms

Guidelines for working with math waveforms

Use the following guidelines when working with math waveforms:
  • Keep math waveforms simple. If the math expression becomes too complex, try separating the expression into more than one math waveform and then combining the waveforms (for example, Math1 = Math2 + Math4).
  • Math waveforms cannot be turned on without a math expression.
  • To avoid syntax errors in a math expression, verify the use of operators, parentheses, operands, and the spelling of functions.
  • When working with reference waveforms, if one or more reference waveforms are used as part of a math waveform, the number of frames in the math waveform is the smallest of all source waveforms (reference, math, or channel waveforms).
  • If one or more reference waveforms are used in a math waveform, the record length is equal to the smallest of all the source waveforms (reference, math, or channel waveforms). The math is calculated using the first point from each source, followed by the next point, and so forth. This is true even if the sources have different times between points in the record.

Math waveform editor syntax

You can build math waveforms using the predefined expressions or the equation editor. To help you create valid math waveforms, the following tools will block most illegal entries by disabling any window element that would create an invalid entry in the math waveform expression.

Predefined expressions are accessible using the FFT or Basic Math Types.

The following syntax describes the valid math expressions you can use with the Equation Editor for the Advanced Math Type:

A math expression is composed of settings, functions, scalars and sources.

Settings have the syntax [settingName=settingValue] and are generally applied to measurements. The setting applies to everything to the right of the closing square brackets.

Example: [CoefFileName="highpass_0.25bw.flt"]HighPass(Ch1)

CoefFileName is the setting and is used as the high pass filter on channel 1.

Example: [CoefFileName="highpass_0.25bw.flt"] HighPass(Ch1) + [CoefFileName="lowpass_0.05bw.flt"] LowPass(Ch2)

The high pass filter file is applied to channel 1 and lowpass_0.05bw.flt is applied to channel 2.

Functions, except for basic and logic functions, have the syntax function(source).

In the previous examples the functions are HighPass and LowPass.

Basic and logic functions have the syntax

source1 function source2.

Examples: Ch1 * Ch2

Ch1 AND Ch2

Ch1 >= Ch2

Logic functions, ==|<|>|!=|<=|>=|AND|OR|NAND|NOR|XOR|EQV result in a waveform consisting of binary 0 and 1 values.

Scalars can be integers, floating point values, PI or meas<x>.

Sources can be Ch<x>, Ref<x>, Math<x>

Math waveform differentiation

The math capabilities of the instrument include waveform differentiation. This allows you to display a derivative math waveform that indicates the instantaneous rate of change of the waveform acquired.

Derivative waveforms are used in the measurement of slew rate of amplifiers and in educational applications. You can create a derivative math waveform and then use it as a source for another derivative waveform. The result is the second derivative of the waveform that was first differentiated.

The math waveform, derived from the sampled waveform, is computed based on the following equation:

Yn = (X( n + 1) - Xn) * 1/T

Where: X is the source waveform, Y is the derivative math waveform, and T is the time between samples.

Since the resultant math waveform is a derivative waveform (see the next figure), its vertical scale is in volts/second (its horizontal scale is in seconds). The source signal is differentiated over its entire record length; therefore, the math waveform record length equals that of the source waveform.


Math waveform offset, position, and scale

The settings that you make for offset, scale, and position affect the math waveform you obtain. Here are some tips for obtaining a good display:
  • Scale and position the source waveform so that it is contained on the screen. (Off-screen waveforms may be clipped, resulting in errors in the derivative waveform).
  • Use vertical position and vertical offset to position your source waveform. The vertical position and offset will not affect your derivative waveform unless you position the source waveform off screen so that it is clipped.

Waveform integration

The math capabilities of the instrument include waveform integration. This allows you to display an integral math waveform that is an integrated version of the acquired waveform.

Use integral waveforms in the following applications:

  • Measuring power and energy, such as in switching power supplies.
  • Characterizing mechanical transducers, as when integrating the output of an accelerometer to obtain velocity.

The integral math waveform, derived from the sampled waveform, is computed based on the following equation:


Where: x(i) is the source waveform, y(n) is a point in the integral math waveform, scale is the output scale factor, and T is the time between samples.

Since the resultant math waveform is an integral waveform, its vertical scale is in volt-seconds (its horizontal scale is in seconds). The source signal is integrated over its entire record length; therefore, the math waveform record length equals that of the source waveform.

Offset and position

When creating integrated math waveforms from live channel waveforms, consider the following:
  • You should scale and position the source waveform so that it is contained on screen. (Off screen waveforms may be clipped, which will result in errors in the integral waveform.)
  • You can use vertical position and vertical offset to position your source waveform. The vertical position and vertical offset will not affect your integral waveform unless you position the source waveform off screen so that it is clipped.

DC offset

The source waveforms that you connect to the instrument often have a DC offset component. The instrument integrates this offset along with the time-varying portions of your waveform. Even a few divisions of offset in the source waveform may be enough to ensure that the integral waveform saturates (clips), especially with long record lengths.

FFT process

The FFT process mathematically converts the standard time-domain signal (repetitive or single-shot acquisition) into its frequency components.

The FFT function processes the waveform record and displays the FFT frequency domain record, which contains the input signal frequency components from DC (0 Hz) to ½ the sample (also called the Nyquist frequency ).


Nyquist frequency

The highest frequency that any digital oscilloscope can measure without errors is one-half of the sample rate. This frequency is called the Nyquist frequency.

The FFT waveform displays the input signal frequency components from DC (0 Hz) to the Nyquist frequency.

FFT and aliasing

Aliasing occurs when the input frequency of a signal is greater than one half of the sampling frequency (the sample rate).

Set the sample rate high enough so that the signals in the spectrum appear at their correct frequency as opposed to a lower aliased frequency value. Also, complex signal shapes that have many harmonics in them, such as a triangle or square wave, can appear to be OK in the time domain when in fact many of the harmonics in that signal are aliased.

One way to check for aliasing is to increase the sample rate and observe whether any of the harmonics unwrap to different frequency locations.

Another way to recognize aliasing is to realize that higher order harmonics usually have decreasing magnitudes compared to lower order harmonics. Thus, if you see a series of increasing harmonic magnitude values as frequency increases then you can suspect that they may be aliased. In the spectral math waveform, the actual higher frequency components are under sampled, and therefore they appear as lower frequency aliases that "fold back" around the Nyquist point. (See the next figure.) You may test by increasing the sample rate and observing if aliases unwrap to different frequency positions.


If you have a variable-frequency signal source, another way to observe aliasing is to adjust the frequency slowly while watching the spectral display. If some of the harmonics are aliased, you will see the harmonics decreasing in frequency when they should be increasing or vice versa.

Blackman-Harris FFT window concepts

FFT windows have various resolution bandwidths and scallop losses (see the figure below). Choose the one that best allows you to view the signal characteristics you are interested in.

The Blackman-Harris window has a low amount of energy leakage compared to the other windows. Its best use is for single frequency signals to look for higher order harmonics.

Blackman-Harris window


Flattop2 window

This window has the lowest scallop loss of any of the windows. It also has a wider resolution bandwidth but lower side lobe attenuation. Also, it is unique because the time domain shape has negative values.

Note:The Flattop2 window is useful for high accuracy magnitude measurements for signals that do not require very narrow bandwidth.


Gaussian window

This is the default window function (see the next figure). It is unique in that the time-domain shape of an exponential Gaussian function transforms into a Gaussian exponential shape in the frequency domain.

Note:This window provides optimal localization in both the time and the frequency domain.


Hanning FFT window

FFT windows have various resolution bandwidths and scallop losses (see the figure below). Choose the one that best allows you to view the signal characteristics you are interested in.

The Hanning window has the narrowest resolution bandwidth, but higher side lobes. Hanning has slightly poorer frequency resolution than Hamming. Hanning is best for measuring sine, periodic, and narrow-band random noise, and transients or bursts where the signal levels before and after the event are significantly different.

Hanning window


Hamming window

This window is unique in that the time domain shape does not taper all the way to zero at the ends. This makes it a good choice if you wanted to process the real and imaginary parts of the spectrum off line and inverse transform it back to the time domain. Because the data does not taper to zero, you can remove the effect of the window function from the result.


Kaiser-Bessel FFT window

A Kaiser-Bessel window balances amplitude accuracy, side lobe distance, and side lobe height. Although similar to the Blackman-Harris window, the near side lobes in a Kaiser- Bessel window tend to be higher for the same main lobe width, while the further-out side lobes are lower. This window can reveal signals close to the noise floor, and analyze two tones with close frequencies but different amplitudes.


Rectangular window

This window is equal to unity (see the next figure). This means the data samples in the gate are not modified before input to the spectral analyzer. Rectangular windows are best for measuring transients or bursts where the signal levels before and after the event are nearly equal.

Note:This window has the narrowest resolution bandwidth of any of the windows, but it also has the most spectral leakage and the highest side lobes.


Tek-Exponential window

In the time domain, it is not a symmetrical bell shape as is the case with the other windows. Instead, it is exponential with a peak at the 20% position of the time domain gate. The frequency domain shape is triangular.

Note:Use this window for impulse-response testing where the 20% position is the zero phase reference point. More of the acquired data record length is used to capture the impulse response.

Exact details of how to compute its values were published in the article;Impulse-Response Testing Lets a Single Test Do the Work of Thousands, by John Pickerd, EDN magazine, April 27, 1995.


Measurement algorithms

Amplitude measurement algorithms

AC RMS measurement algorithm

AC RMS is the true Root Mean Square of the data points about the Mean (µ). This measurement can be made across the entire record or on each cycle in the record.

Area measurement algorithm

Area is the arithmetic area for one waveform. The area measured above ground is positive. The area measured below ground is negative. Remember that one waveform is not necessarily equal to one cycle. For cyclical data you may prefer to use the cycle area rather than the arithmetic area.


Details of the integration algorithm are given later Integration Algorithm.

Amplitude measurement algorithm

Amplitude is the difference between the Top value and the Base value.

Amplitude = Top - Base

Base measurement algorithm

Base is calculated using the selected Base Top method. Base is the most common data value below the midpoint of the waveform, when the default Base Top method Histogram Mode is selected. This measurement can be made across the entire record or on each cycle in the record.

Integration algorithm

The integration algorithm used by the instrument is as follows:


W(t) is the sampled waveform

Ŵ(t) is the continuous function obtained by interpolation of W(t)

A and B are numbers between 0.0 and RecordLength – 1.0

If A and B are integers, then:


where s is the sample interval.

Similarly,


W(t) is the sampled waveform

Ŵ(t) is the continuous function obtained by interpolation of W(t)

A and B are numbers between 0.0 and RecordLength – 1.0

If A and B are integers, then:


where s is the sample interval.

Maximum measurement algorithm

Maximum is the maximum data point. Typically the most positive peak voltage.

Mean measurement algorithm

Mean is the arithmetic mean of the data points. Remember that one waveform is not necessarily equal to one cycle. For cyclical data you may prefer to use the cycle mean rather than the arithmetic mean.


Details of the integration algorithm are given in Integration algorithm .

Minimum measurement algorithm

Minimum is the minimum data point. Typically the most negative peak voltage.

Negative Overshoot measurement algorithm

Negative Overshoot is the difference between Minimum and Base, divided by the amplitude. It is the percent that the waveform goes below base.


Note that overshoot values should never be negative (unless Top or Base are set out-of-range).

Positive Overshoot measurement algorithm

Positive Overshoot is the difference between Maximum and Top, divided by the amplitude. It is the percent that the waveform goes above top.


Note that this value should never be negative.

Peak-To-Peak measurement algorithm

Peak to peak is the difference between Maximum and Minimum.

PeaktoPeak = Max – Min

RMS measurement algorithm

RMS is the true root mean square of the data points.

Top measurement algorithm

Top is calculated using the selected Base Top method. Top is the most common data value above the midpoint of the waveform, when the default Base Top method Histogram Mode is selected. This measurement can be made across the entire record or on each cycle in the record.

Time measurement algorithms

Burst Width measurement algorithm

Burst Width is the duration of a series of adjacent crossings of the mid reference level. The duration of a burst. Bursts are separated by a user-defined idle time.

Data Rate measurement algorithm

Data Rate is the reciprocal of Unit Interval. This measurement is made on each bit in the record.

Delay measurement algorithm

Delay is the time between a mid reference level edge on one source to a mid reference level edge on a second source. The direction of each edge can be configured by the user.

Falling slew rate

Falling Slew Rate is the rate of change in value as an edge transitions from the high or mid reference level to the mid or low reference level. The levels are configurable.

In the diagram below, the Falling Slew Rate from mid ref to low ref is calculated using the following equation:

Falling Slew Rate = (VREF - VREFLO)/ΔTF


Fall Time measurement algorithm

Fall Time is the time required for an edge to fall from the high reference level to the low reference level. By default the measurement is from reference level 90% amplitude to 10% amplitude.

The following figure shows a falling edge with the two edges necessary to calculate a Fall measurement. The figure shows the default high reference level which is 90% of Top and the default low reference level which is 10% of Base.

  1. Searching from Start to End, find the first sample in the measurement zone greater than HighRef.
  2. From this sample, continue the search to find the first (negative) crossing of edge of HighRef. The time of this edge is THF. (Use interpolation if necessary.)
    Figure 1. Fall Time


  3. From THF, continue the search, looking for a crossing of LowRef. Update THF if subsequent HighRef crossings are found. When a LowRef crossing is found, it becomes TLF. (Use interpolation if necessary.)
  4. FallTime = TLFTHF

Frequency measurement algorithm

Frequency is the reciprocal of the period. Frequency is typically measured in Hertz (Hz) where 1 Hz = 1 cycle per second.

Frequency = 1 / Period

High Time measurement algorithm

High Time is the amount of time that a waveform cycle is above the High reference voltage level.

The application calculates the measurement using the following equation:


Where:

T High is the high time.

T Hi- is the High reference crossing on the falling edge.

T Hi+ is the High reference crossing on the rising edge.

Hold Time measurement algorithm

Hold Time is the time between the mid reference level crossing of the clock source (Source1) and the next mid reference level crossing of the data source (Source2). The crossings (edges) may be configured to be rising, falling or either.

The application calculates this measurement using the following equation:


Where:

T Hold is the hold time.

T Main is the source 1 (clock) Mid reference edge time in the configured direction.

T 2nd is the source 2 (data) Mid2 reference edge time in the configured direction.

Low Time measurement algorithm

Low Time is the amount of time that a waveform cycle is below the Low reference voltage level.

The application calculates this measurement using the following equation:


Where:

T Low is the low time.

T Lo+ is the Low reference crossing on the rising edge.

T Lo- is the Low reference crossing on the falling edge.

N-Periods Duration measurement algorithm

Duration N-Periods is the time required to complete N cycles.

The source can be configured to be treated as either a clock or data waveform. Given a voltage waveform, the N-Period is calculated as follows:

If the Signal Type is Clock

The N–Period measurement calculates the elapsed time for N consecutive crossings of the mid reference voltage level in the direction specified.

The application calculates this measurement using the following equation:


Where:

NP Clock is the accumulated period for N clock cycles.

T Clock is the VRefMid crossing time for the configured edge direction.

If the Signal Type is Data

The N–Period measurement calculates the elapsed time for N consecutive unit intervals.

The application calculates this measurement using the following equation:


Where:

NP Data is the duration for N unit intervals.

T Data is the VRefMid crossing time in either direction.

If T n+N Data does not exist for a given n, no measurement is recorded for that position.

Negative Duty Cycle measurement algorithm

Negative Duty Cycle is the ratio of the negative pulse width to the signal period expressed as a percentage.

NegativeWidth is defined in Negative Pulse Width, below.

If Period = 0 or undefined then return an error.


Negative Pulse Width measurement algorithm

Negative Pulse Width is the time (or distance) the signal remains below the mid reference level. It is the distance from a falling edge to the next rising edge.

Period measurement algorithm

The time between two adjacent crossings of the Mid reference level (one cycle) of the waveform. Period is measured in horizontal units, typically seconds.

Period = Edge3 - Edge1

Phase measurement algorithm

Phase is the ratio of the Skew between two sources to the Period of the first source. It is the amount of phase shift between edges of the two waveforms. The phase shift is expressed in degrees of the Source1 waveform cycle, where 360 degrees is one complete cycle (Period) of Source1. For best results, Source1 and Source2 should be of the same frequency or one waveform should be a harmonic of the other.

Phase is determined in the following manner for each cycle of the record:

  1. The first two adjacent edges of the configured 'from' edge type are found in Source1.
  2. The period of Source1 is calculated (see Period above). If the "from" edge is set to either, the half-period of Source1 is calculated.
  3. The first edge in Source2 in the configured 'to' edge direction is found.
  4. The Skew from the first Source1 edge to the next Source2 edge is calculated.

    (Skew/Period)*360

  5. When "from" edge is either, the calculation is (Skew/half-Period)*180.

Positive Duty Cycle measurement algorithm

Positive Duty Cycle is the ratio of the positive pulse width to the signal period, expressed as a percentage.

PositiveWidth is defined in Positive Pulse Width, following.


Positive Pulse Width measurement algorithm

Positive Pulse Width is the time the signal remains above the mid reference level. It is the distance from a rising edge to the next falling edge.

Rising Slew Rate measurement algorithm

Rising Slew Rate is the rate of change in value as an edge transitions from the low or mid reference level to the mid or high reference level. The levels are configurable.

In the diagram below, the Rising Slew Rate from mid ref to high ref is calculated using the following equation:

(VREFHI - VREF)/ΔTR


Rise Time measurement algorithm

Rise Time is the time required for an edge to rise from the low reference level to the high reference level. By default the measurement is from reference level 10% amplitude to 90% amplitude.

The following figure shows a rising edge with the two crossings necessary to calculate a Rise Time measurement.

  1. Searching from Start to End, find the first sample in the measurement zone less than LowRef.
  2. From this sample, continue the search to find the first (positive) crossing of LowRef. The time of this crossing is the low rise time or TLR. (Use linear or sin interpolation if necessary.)
  3. From TLR, continue the search, looking for a crossing of HighRef. Update TLR if subsequent LowRef crossings are found. If a HighRef crossing is found, it becomes the high rise time or THR. (Use linear or sin interpolation if necessary.)
  4. RiseTime = THR – TLR


Setup

Setup Time is the time between the mid reference level crossing of the clock source (Source1) and the closest previous mid reference level crossing of the data source (Source2). The crossings (edges) may be configured to be rising, falling or either.

The application calculates this measurement using the following equation:


Where:

T Setup is the setup time.

T Main is the Main input (clock) Mid reference crossing time in the specified direction.

T 2nd is the 2nd input (data) Mid2 reference crossing time in the specified direction.

Skew

Skew is the time between the mid reference level crossing on Source1 to the mid reference level crossing on Source2. The direction of the edge crossing is configurable.

The application calculates this measurement using the following equation:


Where:

T Skew is the timing skew.

T Main is the Main input Mid reference crossing time in the configured direction.

T 2nd is the 2nd input Mid2 reference crossing time in the configured direction.

Time Outside Level measurement algorithm

Time Outside Level is the time the signal remains above the high reference level and/or below the low reference level.


Time to Max

Time to Max is the amount of time from the trigger point to the maximum data point. This measurement can be made across the entire record or on each cycle in the record.

Time to Min

Time to Min is the amount of time from the trigger point to the minimum data point. This measurement can be made across the entire record or on each cycle in the record.

Unit Interval measurement algorithm

Unit Interval is the time difference between two successive bits. This measurement is made on each bit in the record. The bits are calculated using clock recovery method constant mean.

Frequency Response Analysis algorithms

Control Loop Response (Bode) measurement algorithm

Control Loop Response (Bode) computes and plots gain as 20 log (Vout/Vin) and phase difference between Vin and Vout at each frequency within the swept band. The resulting plot is commonly referred to as a Bode Plot.

Points per decade is 10 by default, maximum is 100.

Start frequency is 100 Hz.

Stop frequency is 10 MHz.

where:
  • 6 is
  • 2 is

The gain and phase margin are two metrics to tell the stability of the system.

Gain for

where:
  • Vout is the amplitude of the input signal.
  • Vin is the input signal.

Phase for Bode is the time shift between the input and output signals.

Help us improve our technical documentation. Provide feedback on our TekTalk documentation forum.